
A report people can’t filter quickly is a report they stop using. Power BI slicers fix that. A slicer sits on the report page and lets anyone click a region, product or date range to filter the visuals instantly, with no filter pane and no training.
This guide covers:
- What a slicer in Power BI is and how it differs from a filter
- Every slicer type: list, dropdown, tile, date range, relative date, numeric range, hierarchy and the newer button and text slicers
- How to add a slicer, step by step
- How to configure single select, multi-select, “Select all”, search, default values and formatting
- How to sync slicers across pages and control which visuals they affect
- Best practices, common problems and FAQs
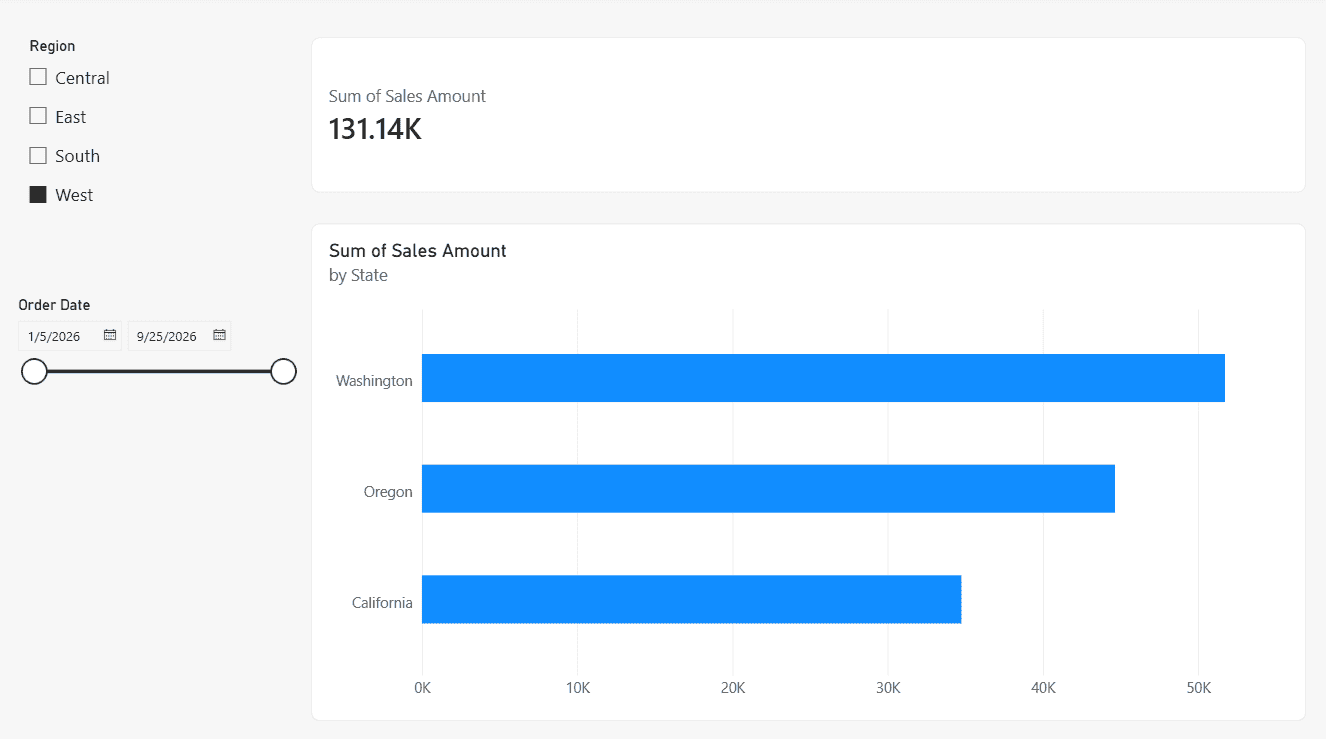
Quick answer: To add a slicer in Power BI Desktop, click an empty spot on the report canvas, select the Slicer icon in the Visualizations pane, and drag a field such as Region into the Field well. Then open Format visual > Slicer settings to choose the style (list, dropdown, or tile), single or multi-select, and a search box.
What Is a Slicer in Power BI?
A slicer is a visual that filters the other visuals on a report page. It shows the values of one field, such as Region, Product Category or Order Date, right on the canvas. When a user picks a value, every connected visual updates to show only the matching data.
Report users like slicers because:
- They can see what is being filtered without opening the filter pane.
- One click changes the whole page.
- They work in Power BI Desktop, the Power BI service, embedded reports and mobile.
Slicer vs filter in Power BI
| Feature | Slicer | Filter pane |
|---|---|---|
| Location | On the report canvas | In the side filter pane |
| Visibility | Always visible to users | Can be hidden or locked |
| Scope | The current page (or several pages through sync) | Visual, page or all pages |
| Best for | Common, interactive filtering | Background or advanced filtering |
| Uses canvas space | Yes | No |
For a detailed comparison, see Power BI filter vs slicer. To learn the filter pane itself, read how to add a filter in Power BI.
Types of Slicers in Power BI
Power BI picks a slicer style from the field’s data type, and you can change it under Format visual > Slicer settings > Options > Style.
1. List slicer (vertical list)
This is the default for text fields. Each value appears as a row with a checkbox or radio button. It works well for short lists like Region or Customer Segment.
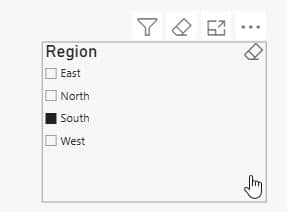
There’s a full walkthrough in Power BI slicer checkbox.
2. Dropdown slicer
A dropdown keeps the values hidden until the user clicks it, so it saves space. It’s the best choice for long lists or crowded dashboards.
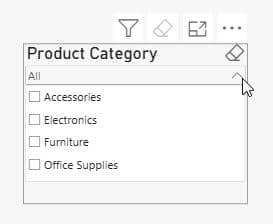
For more examples, see Power BI slicer dropdown.
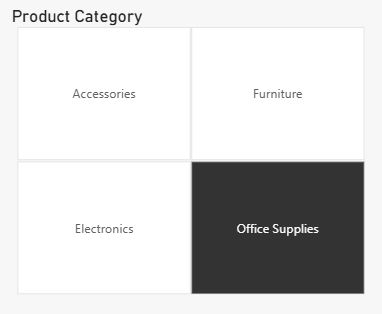
3. Tile (button) slicer
The tile style shows values as clickable buttons laid out horizontally. It looks modern and suits a small number of values, such as years or segments.
I go deeper on this style in Power BI slicer buttons.
4. Date slicers (Between, Before, After, List, Dropdown)
When you add a date field, Power BI shows a Between range slicer with a timeline bar and two calendar pickers. You can switch it to Before, After, List or Dropdown.
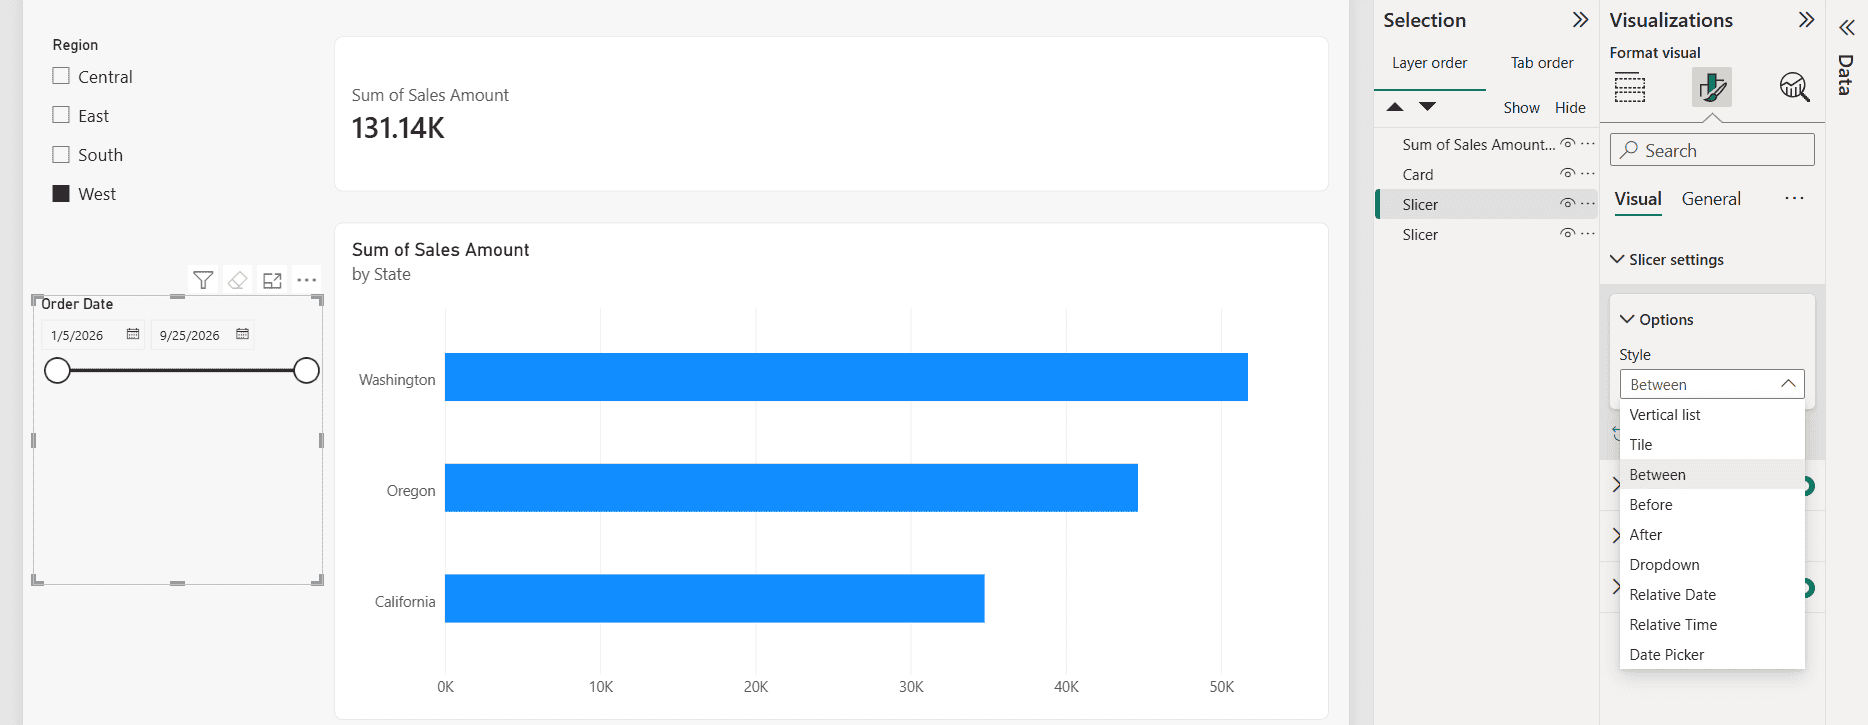
You’ll find the setup steps in Power BI slicer between two dates and Power BI date filter.
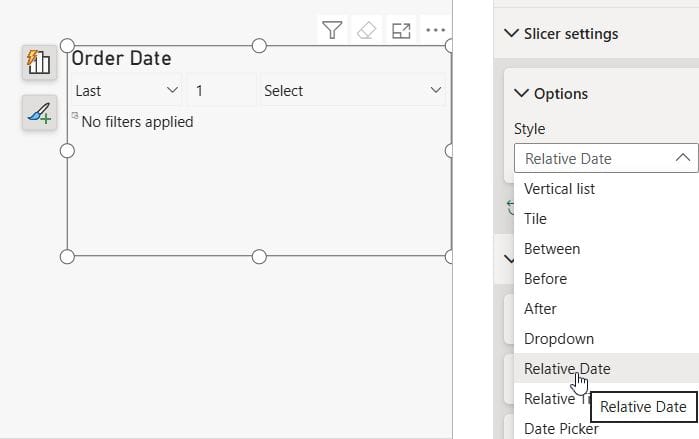
5. Relative date and relative time slicer
This slicer filters to a rolling period such as Last 7 days, This month or Next 2 quarters. The period updates automatically every day, so you don’t edit the report. The Relative time option works the same way for minutes and hours.
6. Numeric range slicer
For numeric fields, Power BI shows a range slider. Users drag it or type minimum and maximum values. The style can be Between, Less than or equal to or Greater than or equal to.
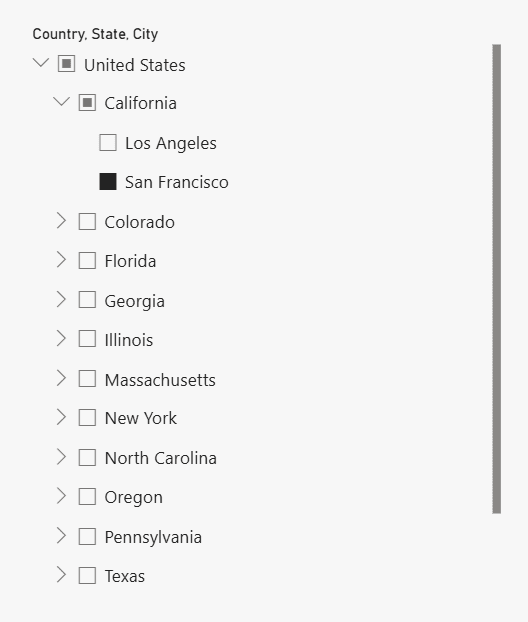
7. Hierarchy slicer
Drop more than one field into the Field well, for example Country > State > City, and you get an expandable hierarchy slicer.
For related techniques, see Power BI slicer multiple columns and Power BI date hierarchy.
8. Newer slicer visuals: button slicer, list slicer and text slicer
Microsoft has added new slicer visuals with richer formatting: a button slicer with images, callouts and layout control, a refreshed list slicer, and a text slicer for free-text “contains” searches. Some may still be previews in your version. If you don’t see them, enable them under File > Options and settings > Options > Preview features.
Learn the details in Power BI slicer contains.
Which slicer type should you use?
| Scenario | Recommended slicer |
|---|---|
| Fewer than 6 values | Tile or button slicer |
| 6–20 values | Vertical list |
| More than 20 values | Dropdown with search |
| Fixed date range | Between date slicer |
| Rolling periods | Relative date slicer |
| Numeric thresholds | Numeric range slicer |
| Category with sub-levels | Hierarchy slicer |
How to Add a Slicer in Power BI (Step by Step)
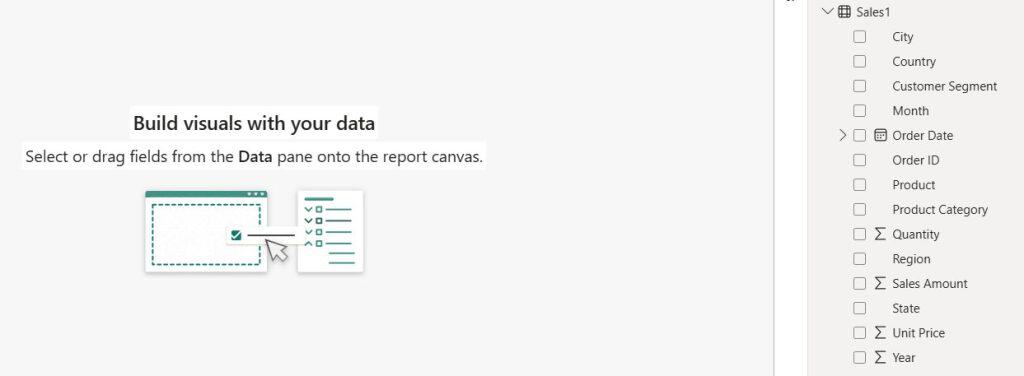
These steps use a simple Sales table with Region, Product, Order Date and Sales Amount columns.
Step 1: Open your report in Power BI Desktop
Open the .pbix file and go to Report view.
Step 2: Select the Slicer visual
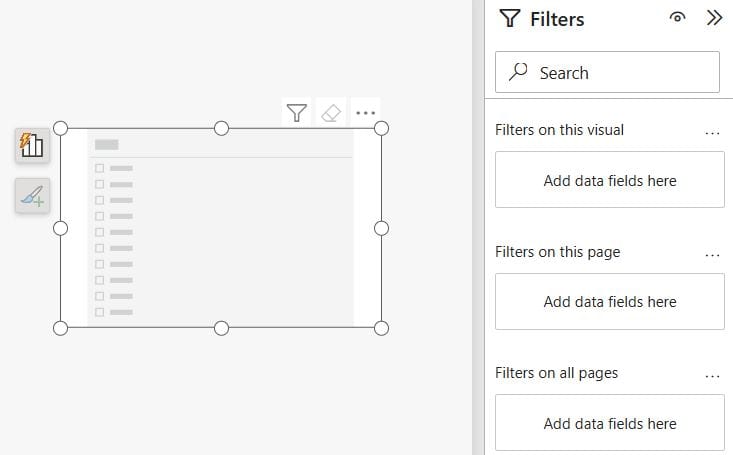
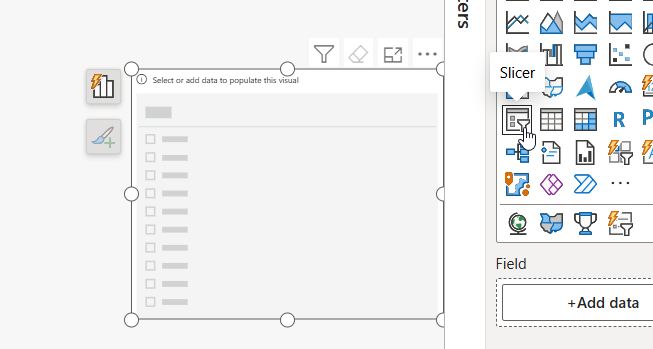
Click an empty area of the canvas. In the Visualizations pane, click the Slicer icon (a funnel with a list). An empty slicer appears on the canvas.
Step 3: Add a field to the slicer
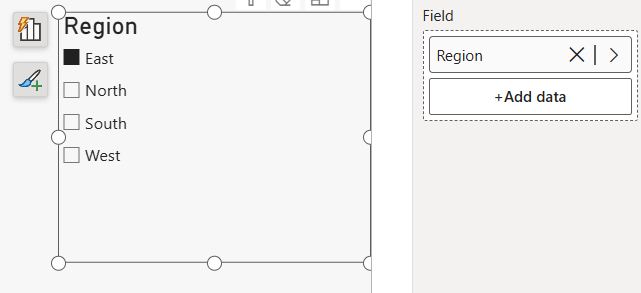
In the Data pane, drag Region into the slicer’s Field well, or check its checkbox while the slicer is selected.
Step 4: Resize and position the slicer
Drag the handles to resize it. Slicers usually go along the top or left side of the page so users know where to filter.
Step 5: Test the slicer
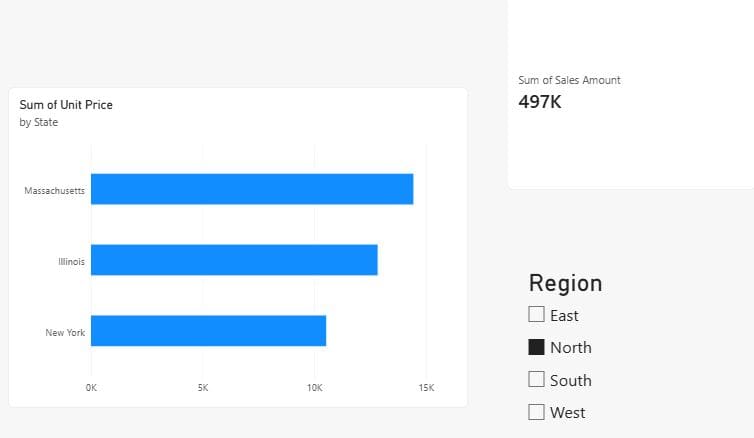
Click a value such as North. Every connected chart, card and table visual should update. Hold Ctrl and click to select several values.
Tip: If you want to create a dashboard in Power BI, add slicers to the report pages first. Pinned dashboard tiles do not support slicers.
How to Configure a Power BI Slicer
Select the slicer and open Format visual (the paintbrush icon). Most settings are under Slicer settings.
Change the slicer style
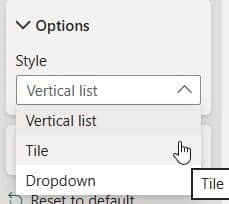
Go to Slicer settings > Options > Style and pick Vertical list, Tile or Dropdown. For dates and numbers, pick Between, Before, After or Relative date.
Single select vs multi-select
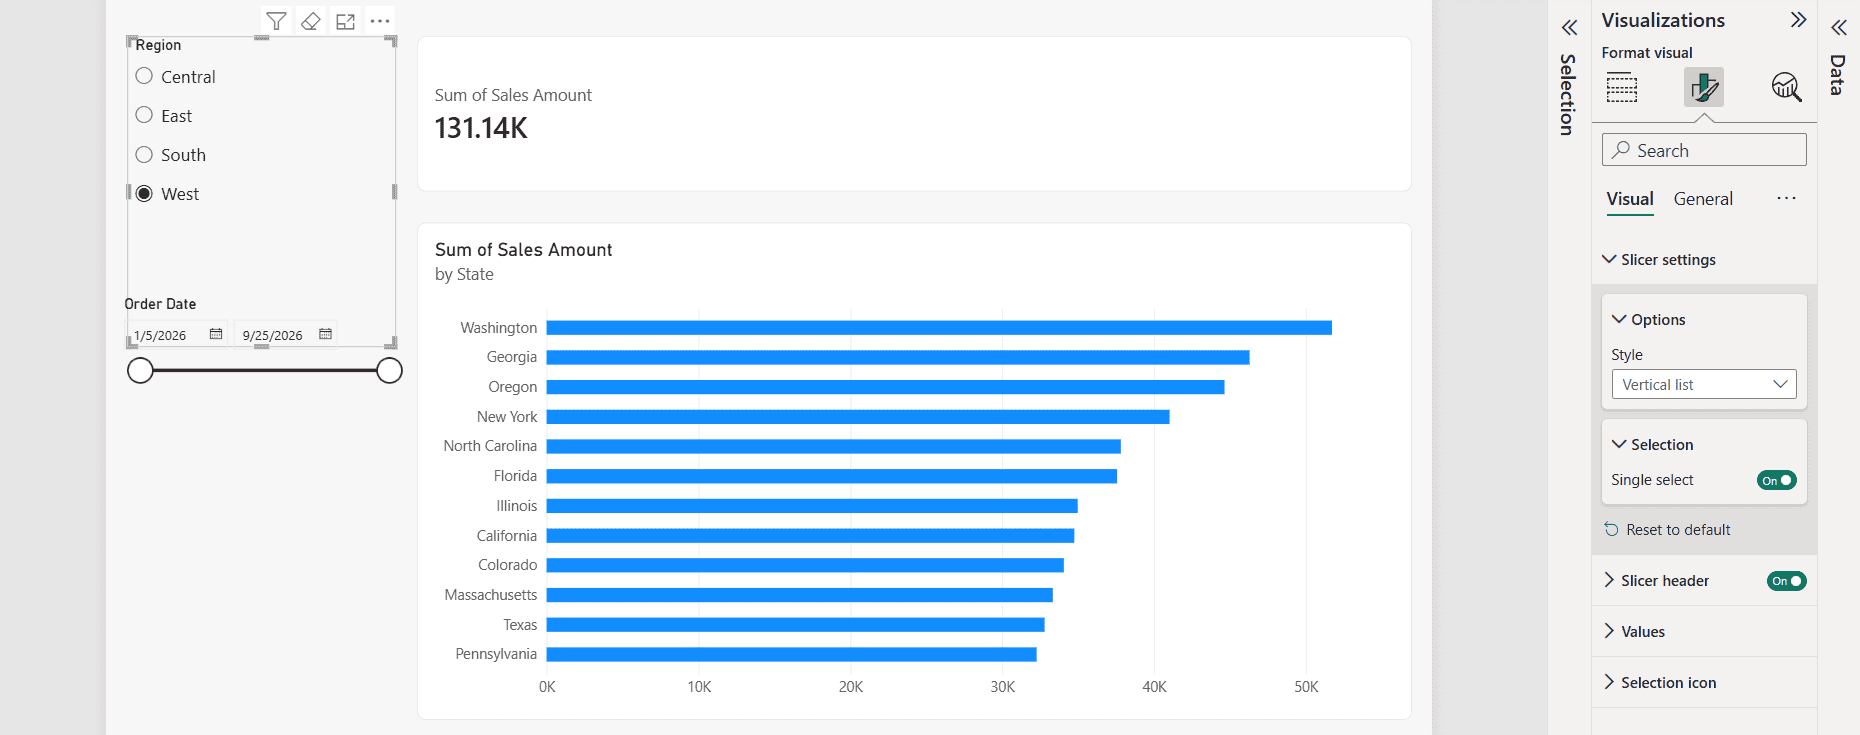
Under Slicer settings > Selection:
- Single select: users can pick only one value, shown as radio buttons.
- Multi-select with Ctrl: users hold Ctrl to pick several values. Turn it off to allow multi-select with plain clicks.
- Show “Select all” option: adds a “Select all” item at the top of the list.
More examples are in Power BI slicer multiple selections.
Add a search box to a slicer
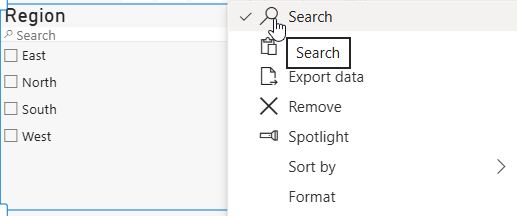
Select the slicer, click More options (…) in its header, and choose Search. A search box appears at the top of list and dropdown slicers.
See the full steps in Power BI slicer search box.
Set a default value
Power BI keeps the slicer selection you have when you save and publish. Select the default values you want, then save. For more control, such as always showing the current month, use a relative date slicer or a calculated column.
There’s a step-by-step example in Set default value in Power BI slicer.
Remove (Blank) from a slicer
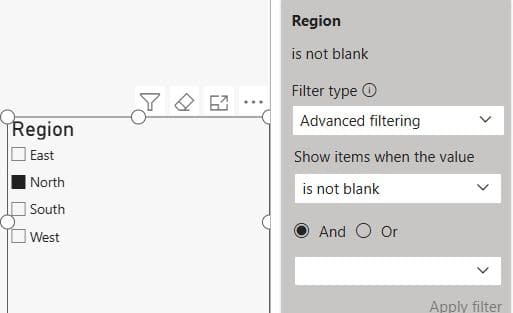
“(Blank)” shows up when the column has empty values. To remove it, open the Filters pane for the slicer, set the field to Basic filtering, and clear (Blank). You can also choose is not blank under Advanced filtering.
Go further with Remove blank from slicer in Power BI.
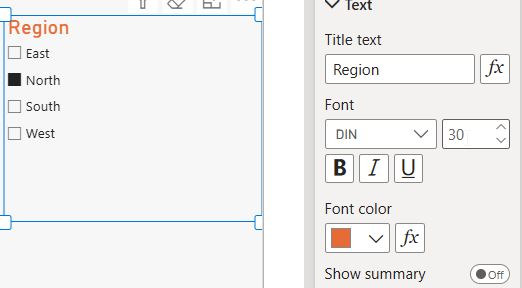
Format the slicer header, values and border
Under Format visual:
- Slicer header: change the title text, font, size and color, or hide it.
- Values: change the font, background and padding.
- General > Effects: add a background, border, rounded corners and shadow.
Add a slicer panel (collapsible filter pane)
You can stack slicers in a side panel and show or hide it with bookmarks and a button. This keeps the page clean.
There’s a full walkthrough in Power BI slicer panel.
How to Sync Slicers Across Multiple Pages
By default, a slicer only filters its own page. I cover every option in how to sync slicers in Power BI. Sync slicers let one selection apply across several pages.
- Select the slicer.
- Go to View > Sync slicers.
- In the Sync slicers pane, check:
- Sync (the refresh icon) for each page that should use the same selection.
- Visible (the eye icon) for each page where the slicer should appear.
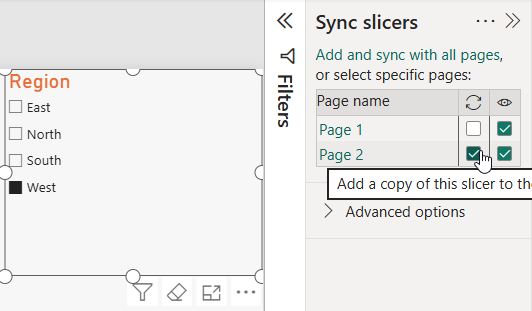
Tip: Check Sync and leave Visible cleared to filter a page without showing the slicer there.
Control Which Visuals a Slicer Filters (Edit Interactions)
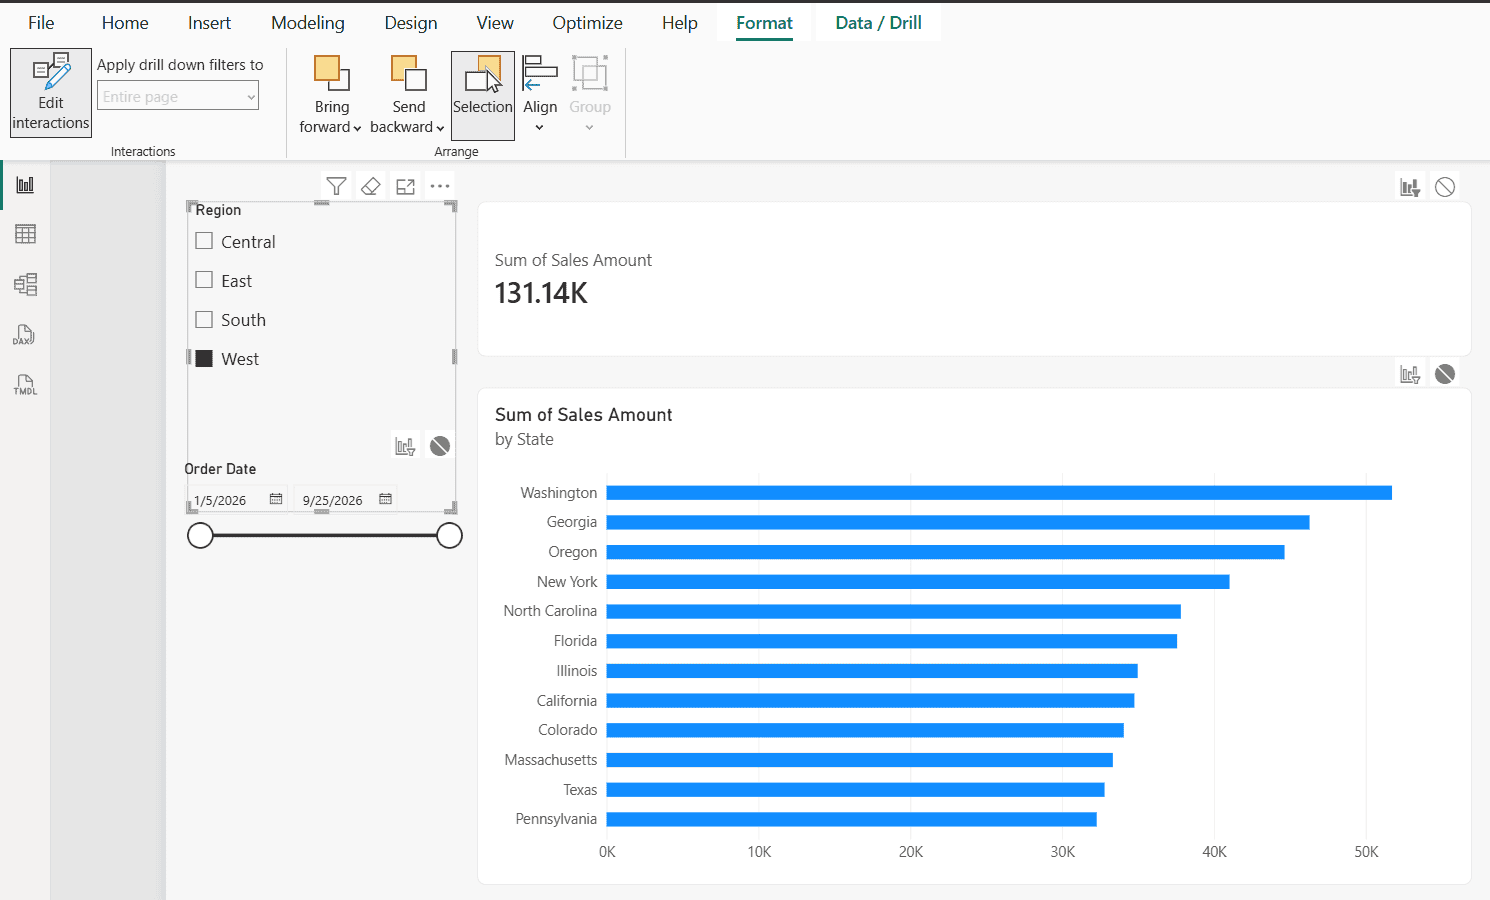
Sometimes a visual should ignore a slicer, such as a “Total Company Sales” card. For all three options, see how to edit visual interactions in Power BI.
- Select the slicer.
- Go to Format > Edit interactions.
- Small icons appear on each visual. Click None (the circle with a line) on any visual that should ignore the slicer.
Advanced Slicer Techniques
- Let one slicer filter another: a Country slicer can limit the values in a City slicer. See Power BI slicer filter another slicer.
- Get the selected value in DAX: use
SELECTEDVALUE()to show dynamic titles or switch measures.
Selected Region =
SELECTEDVALUE ( Sales[Region], "All Regions" )
For more examples, see Power BI get selected value from slicer.
- Measures based on a slicer: build what-if and dynamic calculations. See Power BI measure based on slicer and Power BI measure filter.
- Use a date table: date slicers work best with a proper date table in Power BI.
Power BI Slicer Best Practices
- Keep it to 3–5 slicers per page. More than that confuses users and slows the report.
- Put slicers in the same place on every page. Top or left works best.
- Use dropdowns for long lists to save space.
- Use sync slicers instead of copying the same slicer to every page.
- Label slicers clearly in the header text.
- Slice on low-cardinality columns. Slicing on millions of unique values hurts performance.
- Add a “Clear selections” button. The eraser icon in the slicer header also works, but a visible reset button helps new users.
- Test in the Power BI service after publishing, because default selections and sync behave as saved.
Common Power BI Slicer Problems and Fixes
| Problem | Cause | Fix |
|---|---|---|
| Slicer doesn’t filter a visual | Missing relationship or interactions turned off | Check model relationships and Edit interactions |
| “(Blank)” appears | Empty values in the column | Filter out blanks in the Filters pane |
| Dates show as a hierarchy | Auto date/time is on | Use the date field instead of the Date Hierarchy, or turn off Auto date/time |
| Slicer is slow | High-cardinality column | Slice on a dimension table column |
| Selection resets after publishing | Report saved with a different selection | Set the selection, save, then republish |
| Slicer missing on other pages | Not synced | Use View > Sync slicers |
Conclusion
Power BI slicers are the simplest way to make a report interactive. You now know every slicer type, how to add one, and how to configure selection, search, defaults, formatting, sync and interactions. Start with one or two slicers on your key fields, follow the best practices above, and add advanced options as your report grows.
To keep learning, browse the full list of Power BI tutorials on EnjoySharePoint, especially Power BI measure examples and Power BI row-level security.
Once your slicers are in place, these guides help you finish the rest of the report:
Frequently Asked Questions
What are the types of slicers in Power BI?
The main types are vertical list, dropdown, tile, date range (Between, Before, After), relative date and time, numeric range, hierarchy, and the newer button, list and text slicers. Slicers in Power BI on Microsoft Learn.
How do I add a slicer in Power BI?
Select the Slicer visual in the Visualizations pane, drag a field into its Field well, then resize and format it.
Can one slicer filter multiple pages?
Yes. Use View > Sync slicers and check Sync for the pages you want.
How do I make a slicer single select?
Go to Format visual > Slicer settings > Selection and turn on Single select.
Can I add slicers to a Power BI dashboard?
No. Dashboard tiles don’t support slicers. Add slicers to the report, or pin a live report page to the dashboard.
What is the difference between a slicer and a filter in Power BI?
Slicers sit on the canvas and are always visible. Filters live in the filter pane and can be hidden, locked or applied at the visual, page or report level.

I have worked with Microsoft technologies for more than 18 years, including SharePoint, Microsoft 365 and the Power Platform (Power Apps, Power Automate and Power BI), at companies like HP, TCS and KPIT. I started EnjoySharePoint in 2011 to share the solutions I build in real projects with readers in the United States, Canada, the United Kingdom, Australia, New Zealand and beyond. Microsoft has recognized this work with the Microsoft MVP award 13 times since 2014.