
On one of my first Power BI projects, the report page had six slicers stacked down the left side, each one a long list of checkboxes. Users had to scroll just to find the chart they were filtering. Switching those slicers to dropdowns freed up half the page and made the report far easier to use, and it’s still the first change I make on most reports today.
Quick answer: Select the slicer, open Format visual > Visual > Slicer settings > Options, and set Style to Dropdown. New slicers already use the dropdown style by default. If you can’t find Slicer settings, you’ve probably added the Button slicer or the List slicer instead of the classic Slicer visual.
In this tutorial, I’ll show you how to turn a slicer into a dropdown, add a search box, set a default value, sort and style the dropdown, and fix the problems people run into most often. Every step matches the current version of Power BI Desktop and Microsoft’s documentation.
What is a dropdown slicer in Power BI?
A slicer is a filter that sits directly on the report page, so readers can narrow down the data without opening the Filters pane. The classic Slicer visual can be displayed in several styles: dropdown, vertical list, tile, between, before, after, relative date, relative time and date picker.
With the Dropdown style, the slicer collapses into a single box. When someone opens it, they see the full list of values and can pick one or several. It takes up less space than any other style, which is why Microsoft now uses it as the default for new slicers. It works with text, number and date columns, and if you add more than one field, it becomes a hierarchy that users can expand.
Dropdown, vertical list or one of the newer slicers?
Power BI now has four slicer visuals, and only the classic Slicer offers a dropdown style. So the first decision is which visual to use. Here’s how I choose:
| What you need | What to use |
|---|---|
| Many values and not much space on the page | Slicer visual with the Dropdown style |
| A handful of values that should always be visible | Slicer visual with the Vertical list or Tile style |
| Filters that look like buttons, with images or icons | The Button slicer |
| A hierarchy with richer formatting and conditional formatting | The List slicer (still in preview) |
| Users typing a value, such as an order number | The Input slicer |
The Button slicer and the List slicer are always shown expanded, so if you need the compact dropdown box, stay with the classic Slicer visual.
How to change a slicer to a dropdown in Power BI
If you already have a slicer that shows a list of check boxes, converting it only takes a moment in Power BI Desktop. Select the slicer on the report canvas, then select Format visual (the paintbrush icon) in the Visualizations pane. On the Visual tab, expand Slicer settings and then Options, and change Style to Dropdown.
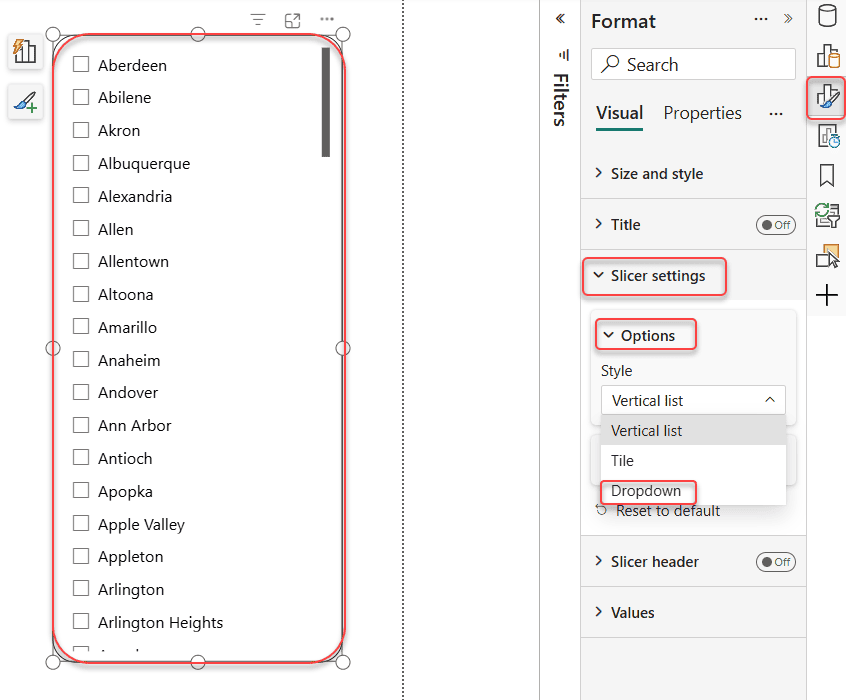
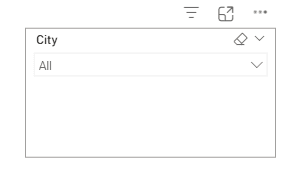
The slicer immediately collapses into a single box with a down arrow. Readers select the arrow to open the list:
If there’s no Slicer settings section in the Format pane, you’ve added the Button slicer or the List slicer by mistake. Delete it, add the classic Slicer visual from the Visualizations pane, and drag your field into it again.
How to add a search box to a dropdown slicer
When a dropdown holds a long list, such as product or employee names, scrolling through it quickly gets tedious. A search box solves that: readers type a few letters and the list shows only the values that match. To turn it on, select the slicer, select More options (…) in its top-right corner, and choose Search. You can also select the slicer and press Ctrl+F. For more detail, see how to add a search box to a Power BI slicer.
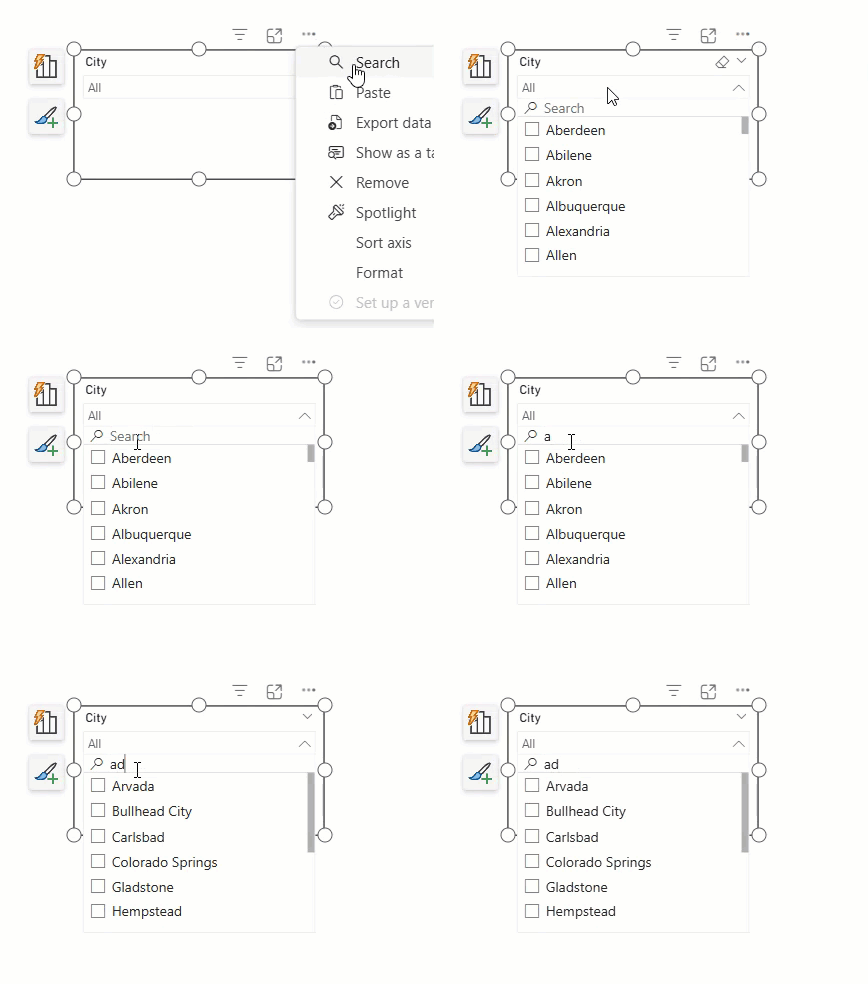
From now on, a search box appears at the top of the list whenever someone opens the dropdown. If the Search option doesn’t appear for a date or number field, a simple workaround is to add a text version of the column and use that in the slicer instead:
Order Month Text = FORMAT ( 'Sales'[Order Date], "mmm yyyy" )How to set a default value in a dropdown slicer
A slicer with nothing selected shows all the data. Often, though, you want the report to open already filtered, for example to the current year or the reader’s own region. There are two reliable ways to do that. For more techniques, see 5 ways to set a default value in a Power BI slicer.
Option 1: Save the report with the value selected
Open the dropdown, select the value or values you want as the default, then save and publish the report. Power BI remembers the selection, so everyone who opens the report sees it. If readers change the selection, they can select Reset to default in the Power BI service to go back to the one you saved.
Option 2: Let each reader save their own default view
In the Power BI service, readers can create a personal bookmark with their own slicer selections and choose Make default. From then on, the report opens in that view for them (Microsoft Learn: bookmarks in the Power BI service). This is ideal when different teams want to start from different filters.
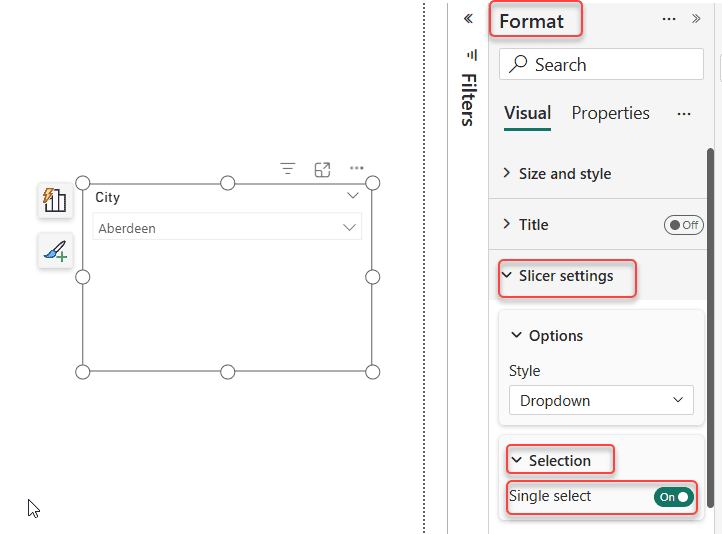
If readers should only ever pick one value, go to Slicer settings > Selection and turn on Single select. It doesn’t set a default on its own, so combine it with Option 1. In the same section, Show “Select all” option adds a Select all entry to the list; it’s off by default.
How to sort the items in a dropdown slicer
Slicer items are sorted in ascending order by default, A to Z for text and lowest to highest for numbers. To reverse the order, select the slicer, open More options (…) and choose Sort axis > Sort descending.
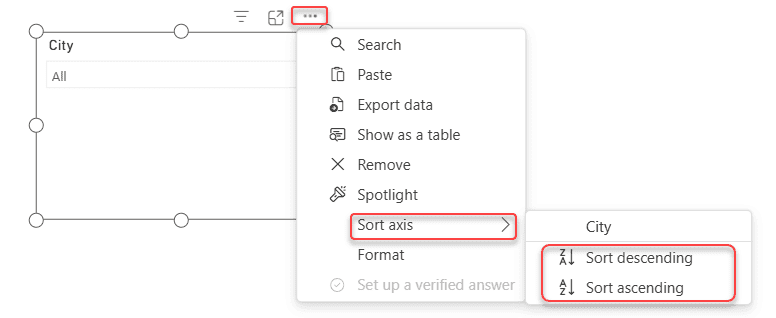
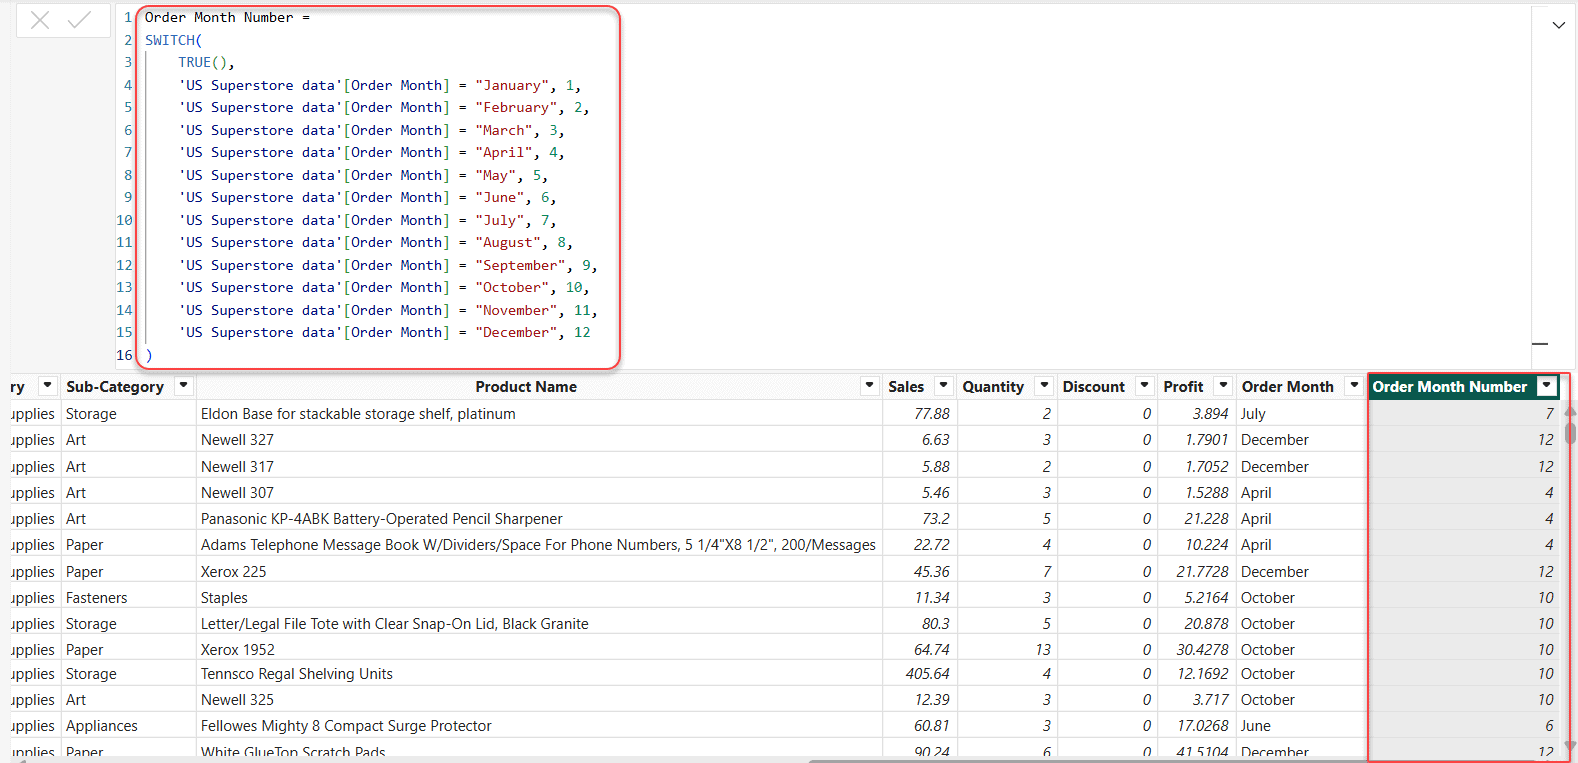
Month names are the classic problem, because they sort alphabetically: April, August, December. To fix this, give Power BI a number to sort by. Add a calculated column like this one, replacing 'Table'[Month] with your own table and column:
MonthNumber =
SWITCH (
    'Table'[Month],
    "January", 1, "February", 2, "March", 3, "April", 4,
    "May", 5, "June", 6, "July", 7, "August", 8,
    "September", 9, "October", 10, "November", 11, "December", 12
)
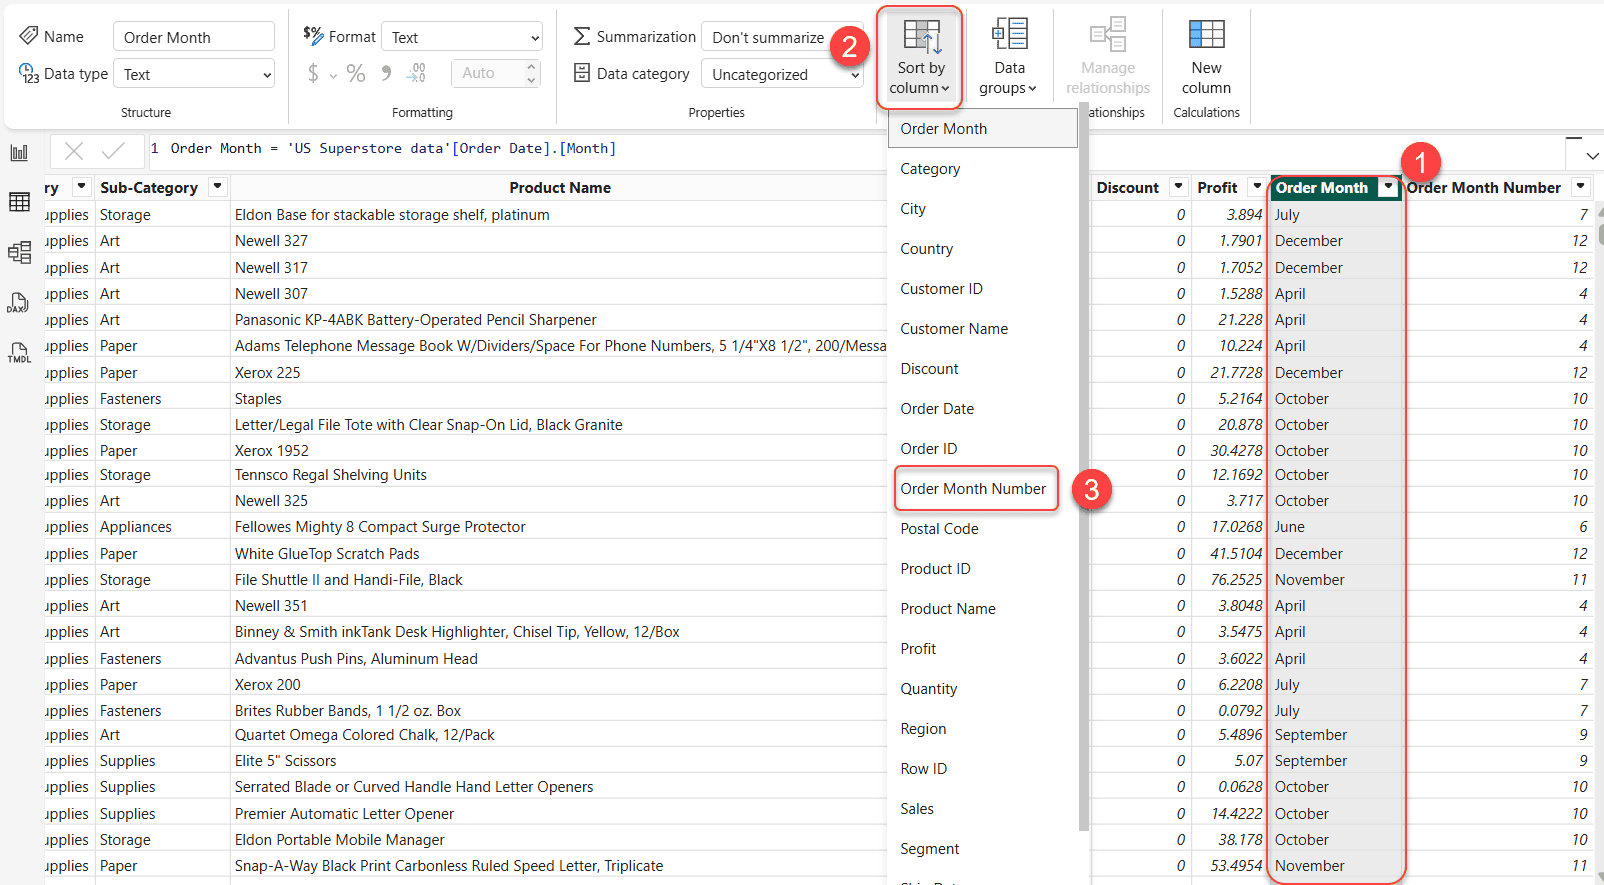
Then select the month name column and go to Column tools > Sort by column > MonthNumber. The dropdown now lists the months in calendar order.
How to style a dropdown slicer
A slicer that matches your report’s colors makes the whole page look finished. Select the slicer and open Format visual > Visual. These are the sections that control how the dropdown looks:
| Section | What it changes |
|---|---|
| Values | The font, font color and Background color. For the dropdown style, the background color fills both the box and the list that opens. |
| Dropdown | The Border color and Rounded corners of the dropdown box, the color and transparency of the Open icon, and an optional Accent bar. |
| Selection icon | The color of the check boxes or radio buttons in the list. |
| Border (Visual tab) | A line over, under or next to each item in the list. |
| Slicer header | The title above the slicer: its text, font and color. |
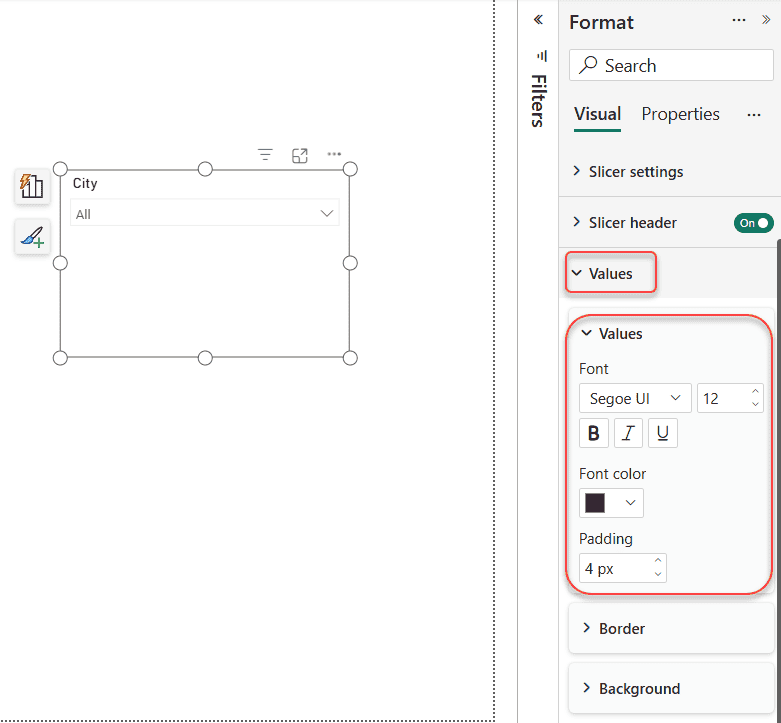
Here’s a dropdown before any formatting, with the default gray text and no background:

And here’s the same slicer after I set a background color and font color in the Values section:

Add a border to the dropdown items
To separate the items in the list, expand Border on the Visual tab and choose a Position (for example, bottom), a Color and a Width. Each item then gets its own line:


The border around the dropdown box itself is a separate setting in the Dropdown section, under Border color. For a border around the whole visual, use General > Effects > Border. If your report has several slicers, it’s worth defining these colors once in a report theme rather than formatting each slicer by hand.
How to use a date field in a dropdown slicer
Dates work in a dropdown too. Add a Slicer visual, drag a date column into Field, and set Style to Dropdown under Slicer settings > Options.
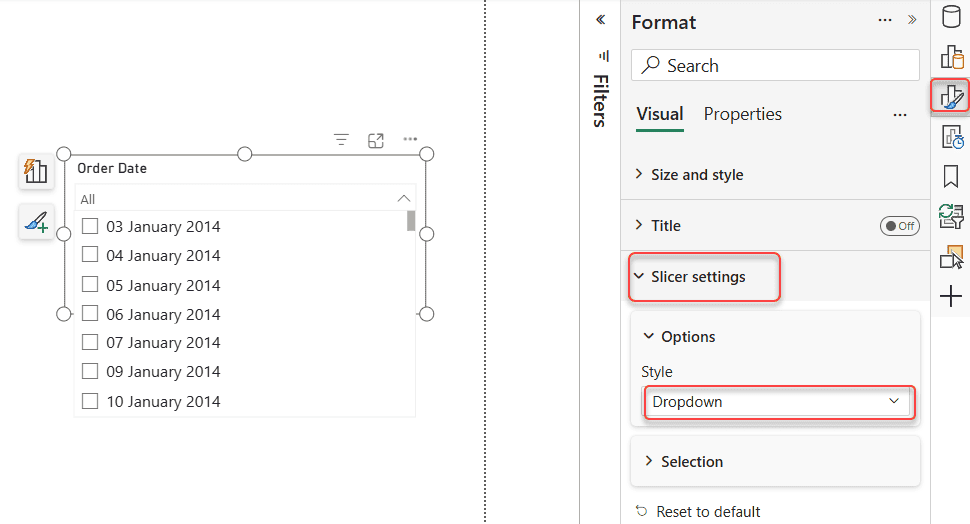
If the column uses Power BI’s automatic date hierarchy, the dropdown shows Year, Quarter, Month and Day levels that readers can expand. For a flat list of dates instead, select the arrow next to the field in the Field well and choose the date column itself rather than Date Hierarchy.
To show the newest dates first, use More options > Sort axis > Sort descending. And if what you really need is a rolling period such as “the last 30 days”, the Relative date or Date picker style is a better fit than a dropdown.
Common dropdown slicer problems and how to fix them
There’s no Dropdown option. You’re almost certainly using the Button slicer or the List slicer. Replace it with the classic Slicer visual. If you still don’t see Slicer settings, update Power BI Desktop to the latest version.
The Search option is missing. Search is available for the Dropdown and Vertical list styles only, so check the style first. For a date or number column, try the text column described earlier.
The dropdown opens off the edge of the screen. This happens when the slicer sits at the far right or bottom of the page. Move it inward, or make the slicer wider.
Select all doesn’t seem to filter anything. That’s by design. Selecting all items gives the same result as clearing the slicer. If you then clear a few items, Power BI applies an “is not” filter for just those items.
The slicer should only filter some visuals. Select the slicer, go to Format > Edit interactions, and choose None on the visuals it shouldn’t affect. To apply the same selection on other pages, use Sync slicers.
Checklist before you publish
- Search is turned on if the list has more than about 15 values.
- The slicer header describes the filter clearly, for example “Select region” rather than “RegionCode”.
- The sort order matches what readers expect: A to Z for names, newest first for dates.
- The report is saved with the default selection you want readers to see.
- The slicer’s colors match the report theme.
- The slicer isn’t pushed against the right edge of the page.
- You used the classic Slicer visual, so the dropdown style is available.
Real-world examples
A sales dashboard with more than 80 products. A product dropdown with search lets a sales manager type the first few letters of a product and filter the whole page, without giving half the canvas to a list.
A monthly finance report. A year dropdown, sorted newest first and saved with the current year selected, opens on the current year every time. Anyone who prefers a different view can save a personal bookmark and make it their default.
Reports read on phones. A long vertical list is hard to use on a small screen, while dropdowns keep the mobile layout clean and usable.
If you’re building report filters, these Power BI slicer tutorials cover the next steps:
- Create a Power BI Slicer Panel – Step By Step
- Power BI Slicer With Multiple Columns: 4 Methods + When to Use Each
- Enable Multiple Selections in Power BI Slicer [Complete Guide]
- How to Create Date Range Slicer in Power BI?
- Power BI Slicer Filter Another Slicer
- How to Remove Blank From Slicer in Power BI?
For the complete list of slicer settings, see Slicer visual in Power BI on Microsoft Learn.
Frequently Asked Questions
How do I change a slicer to a dropdown in Power BI?
Select the slicer, open Format visual > Visual > Slicer settings > Options and set Style to Dropdown. New slicers use the Dropdown style by default.
Can the List slicer or the Button slicer be a dropdown?
No. The Button slicer and the List slicer (preview) are always expanded. Only the classic Slicer visual has a Dropdown style.
How do I set a default value in a Power BI dropdown slicer?
Select the value, then save and publish the report; readers see that selection when they open it, and Reset to default brings it back. In the Power BI service, each reader can also save a personal bookmark and choose Make default.
Can I select more than one value in a dropdown slicer?
Yes. Hold Ctrl to select several values, unless Single select is turned on under Slicer settings > Selection. You can also turn on Show “Select all” option there.
Can I change the border color of the dropdown box?
Yes. Open Format visual > Visual > Dropdown and set Border color. The same section has Rounded corners, the open icon color and an accent bar.
How do I sort a dropdown slicer in descending order?
Select More options (…) on the slicer, then Sort axis > Sort descending.
Does a dropdown slicer filter other pages?
Only if you sync it. Open View > Sync slicers, select the slicer and choose the pages where it should filter.

I have worked with Microsoft technologies for more than 18 years, including SharePoint, Microsoft 365 and the Power Platform (Power Apps, Power Automate and Power BI), at companies like HP, TCS and KPIT. I started EnjoySharePoint in 2011 to share the solutions I build in real projects with readers in the United States, Canada, the United Kingdom, Australia, New Zealand and beyond. Microsoft has recognized this work with the Microsoft MVP award 13 times since 2014.