
If you have ever opened the Power Query Editor in Power BI Desktop and stared at the Merge Queries and Append Queries buttons wondering which one you need, you’re not alone. Both combine data from multiple tables, but they work in completely different directions. Pick the wrong one, and you’ll end up with duplicated rows, null-filled columns, or a model that’s slower than it needs to be.
In this guide, I’ll explain the difference between Merge and Append in Power BI, show you step-by-step how to use each in the latest version of Power BI Desktop, walk through all six join kinds, cover fuzzy matching, and share the real-world rules I use to decide which one to pick.
Quick answer: Append stacks tables on top of each other and adds rows, so use it when the tables have the same columns. Merge joins tables side by side on a matching key and adds columns, so use it when the tables share a field such as CustomerID. Both live under Home > Combine in the Power Query Editor.
Download the Sample Workbook
Download the practice file: Follow along with the free Merge vs Append Power BI sample Excel workbook. It includes Sales_East, Sales_West, and Sales_Central (for Append), Orders, Customers, and Store (for Merge and anti joins), and Vendors and Vendor_Invoices (for fuzzy matching). Each sheet is a named Excel table, so it shows up by name in the Power BI Navigator.
Merge vs Append in Power BI: The Quick Answer
Here’s the short version:
- Append stacks tables on top of each other. It adds rows. Use it when your tables have the same columns (for example, January Sales + February Sales + March Sales).
- Merge joins tables side by side using a matching key column. It adds columns. Use it when your tables share a common field (for example, Orders + Customers joined on CustomerID).
Think of it like this: Append is SQL’s UNION ALL; Merge is SQL’s JOIN. When you’re ready for the full walkthrough, see how to append tables in Power BI.
Merge vs Append: Side-by-Side Comparison Table
| Feature | Append Queries | Merge Queries |
|---|---|---|
| Direction | Vertical (adds rows) | Horizontal (adds columns) |
| SQL equivalent | UNION ALL | JOIN (Left, Inner, Full, etc.) |
| Requirement | Similar column names/structure | At least one matching key column |
| Number of tables | Two, or three or more at once | Two at a time |
| Result row count | Sum of all rows | Depends on join kind |
| Removes duplicates? | No | No (can multiply rows on duplicate keys) |
| Power Query M function | Table.Combine | Table.NestedJoin / Table.FuzzyNestedJoin |
| DAX equivalent | UNION | NATURALLEFTOUTERJOIN, NATURALINNERJOIN |
| Typical use | Monthly files, regional sheets, historical + current data | Lookups, enriching fact tables, finding missing records |
What Is Append Queries in Power BI?
Append Queries combines two or more tables by stacking their rows into a single, longer table. Power Query matches columns by name, not by position. If a column exists in one table but not another, Power BI still includes it and fills the missing values with null.
Example: You have Sales_East (500 rows) and Sales_West (300 rows), both with Date, Product, and Amount columns. Appending them gives you one Sales_All table with 800 rows.
How to Append Queries in Power BI Desktop (Step-by-Step)
- Open Power BI Desktop and load your tables (for example, from Excel, SharePoint, or SQL). Need help connecting? See how to create a Power BI report from a SharePoint list and Excel.
- On the Home tab, select Transform data to open the Power Query Editor.
- In the Queries pane, select the first table.
- On the Home tab, in the Combine group, select the Append Queries dropdown, then choose Append Queries as New (recommended, so your original tables stay intact).
- In the Append dialog box, choose Two tables (pick the First table and Second table) or Three or more tables (move tables from Available tables to Tables to append using the Add >> button and reorder with the arrows).
- Select OK. A new query named Append1 appears. Rename it to something meaningful, like Sales_All.
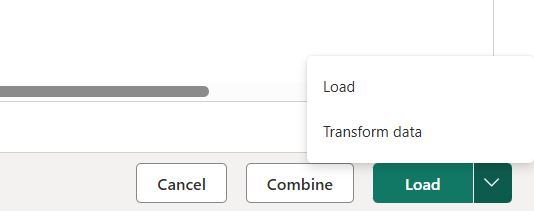
- Select Close & Apply.
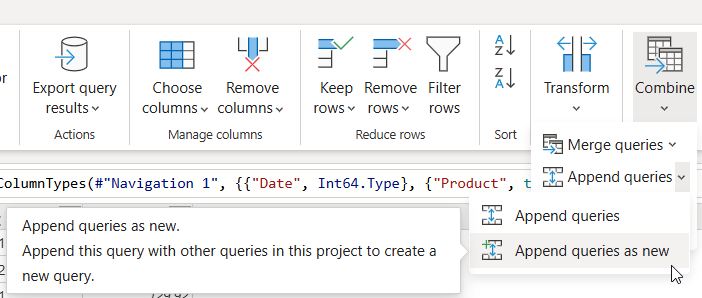
Append Queries vs Append Queries as New
Append Queries adds a step to the currently selected query and changes it permanently. Append Queries as New creates a brand-new query and leaves the source tables untouched. In almost every case, choose as New. Then right-click each source query and clear Enable load so you don’t load duplicate data into your model.
The M Code Behind Append
Behind the scenes, Power BI writes this in the Advanced Editor:
= Table.Combine({Sales_East, Sales_West, Sales_Central})Tip: Append an Entire Folder of Files Automatically
If you get a new Excel or CSV file every month, don’t append them manually. Use Get data > Folder (or SharePoint folder) and select Combine & Transform Data. Power BI appends every file in the folder, and new files are picked up on each refresh.
What Is Merge Queries in Power BI?
Merge Queries joins two tables horizontally based on one or more matching columns (keys). The result is a new column containing nested tables, which you then expand to pull in the columns you need.
Example: Your Orders table has CustomerID but no customer name. Your Customers table has CustomerID, Name, and State. Merging on CustomerID lets you bring Name and State into Orders.
How to Merge Queries in Power BI Desktop (Step-by-Step)
- On the Home tab, select Transform data.
- Select your main (left) table in the Queries pane, for example Orders.
- On the Home tab, in the Combine group, select Merge Queries > Merge Queries as New.
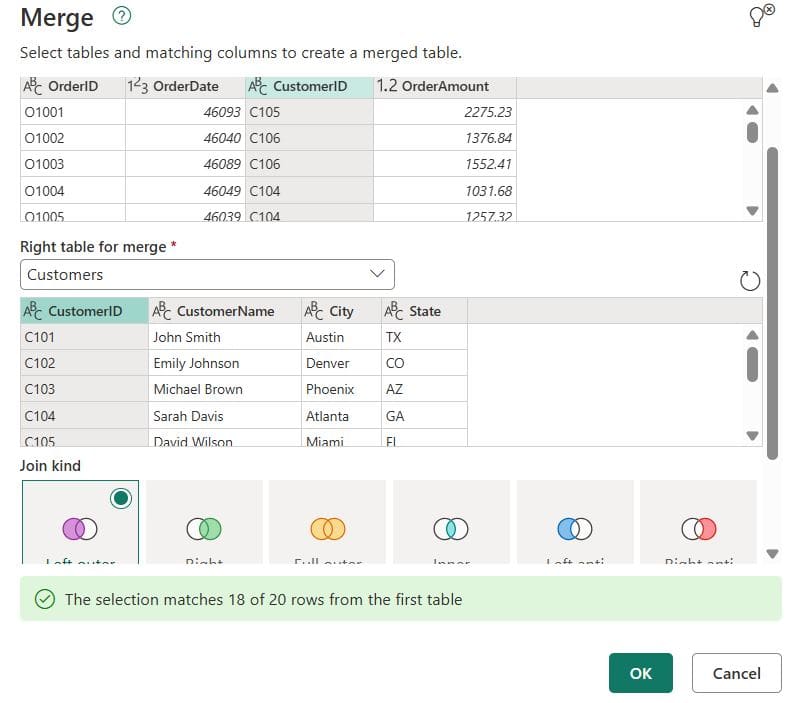
- In the Merge dialog, the top table is the left table; click its key column header (CustomerID). From the second dropdown, select the right table (Customers) and click its matching column. To match on multiple columns, hold Ctrl and select them in the same order in both tables.
- Choose a Join Kind (Left outer is the default).
- Check the match summary at the bottom, e.g., “The selection matches 4,812 of 5,000 rows from the first table.” This is your first data quality check.
- Select OK.
- Click the expand icon (two arrows) on the new column header, choose the columns you need, and clear Use original column name as prefix for cleaner names.
- Select Close & Apply.
Power BI Merge Join Kinds Explained
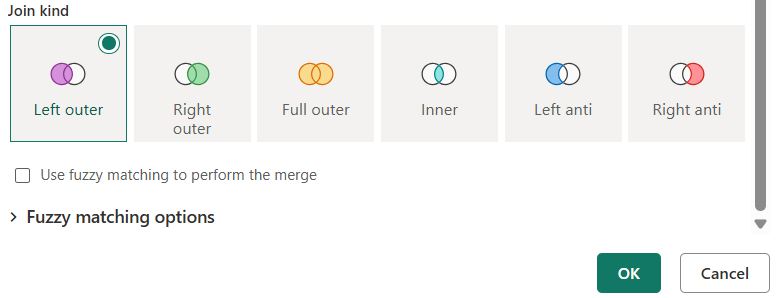
The latest version of Power BI Desktop offers six join kinds in the Merge dialog:
| Join Kind | What It Returns | When to Use It |
|---|---|---|
| Left outer (default) | All rows from the left table + matching rows from the right | Lookups: add customer names to orders |
| Right outer | All rows from the right table + matching rows from the left | Rarely needed; swap tables and use Left outer instead |
| Full outer | All rows from both tables | Reconciling two systems (e.g., CRM vs. ERP) |
| Inner | Only rows that match in both tables | Keep only valid, matched records |
| Left anti | Rows in the left table with no match in the right | Find orders with no customer record, unbilled shipments |
| Right anti | Rows in the right table with no match in the left | Find customers who never placed an order |
Using Fuzzy Matching in Merge Queries
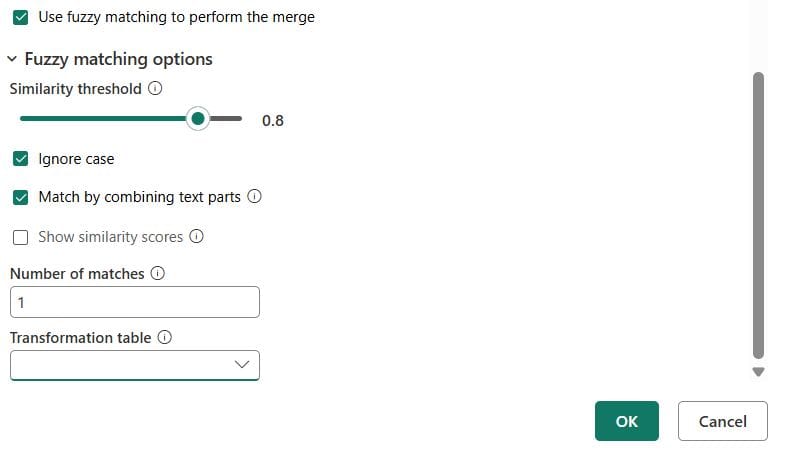
Real-world data is messy: “Microsoft Corp” vs. “Microsoft Corporation,” or “New York” vs. “new york “. In the Merge dialog, check Use fuzzy matching to perform the merge, then expand Fuzzy matching options:
- Similarity threshold – a value from 0 to 1 (default 0.80). Lower values match more loosely.
- Ignore case – treats “SEATTLE” and “Seattle” as the same.
- Match by combining text parts – matches “Micro soft” with “Microsoft.”
- Maximum number of matches – limits how many right-table rows match each left row (set to 1 to avoid duplicates).
- Transformation table – a two-column (From/To) mapping table for known aliases, like “NYC” → “New York.”
Fuzzy matching only works on text columns and is slower, so use it for cleanup, not on millions of rows.
The M Code Behind Merge
= Table.NestedJoin(Orders, {"CustomerID"}, Customers, {"CustomerID"}, "Customers", JoinKind.LeftOuter)Key Differences Between Merge and Append in Power BI
1. Rows vs. Columns
Append makes your table longer. Merge makes it wider. That’s the single most important difference.
2. Structure Requirements
Append needs tables with the same (or very similar) column names. A column called “Amount” in one table and “Sales Amount” in another will become two separate columns with nulls. Merge doesn’t care about overall structure; it only needs a shared key with the same data type.
3. Row Count Behavior
Append is predictable: 500 + 300 = 800 rows. Merge depends on the join kind and on key uniqueness. If your right table has duplicate keys, a Left outer merge will multiply rows in the left table. Always remove duplicates on the key column in your lookup table first.
4. Performance
Append is lightweight. Merge can be expensive on large tables, especially when sources don’t support query folding (Excel, CSV, SharePoint lists). For big datasets, push merges back to SQL Server, or use model relationships instead. Slow merges also stretch out every scheduled refresh in Power BI.
When to Use Append in Power BI
- Combining monthly, quarterly, or yearly files with the same layout (see how to combine two tables with the same columns).
- Bringing together regional or departmental sheets (East, West, Central).
- Combining historical archive data with current data.
- Stacking data from different sources that share a schema (e.g., a SharePoint list + an Excel file).
- Building a single date or dimension list from multiple tables before removing duplicates.
When to Use Merge in Power BI
- Adding descriptive fields (names, categories, regions) to a fact table.
- Finding missing or unmatched records with Left anti or Right anti joins.
- Reconciling data between two systems with a Full outer join.
- Flattening a snowflake schema (e.g., merging Product Subcategory into Product) to simplify your model.
- Matching messy text values with fuzzy matching when you merge tables.
Merge vs Relationships: Do You Even Need to Merge?
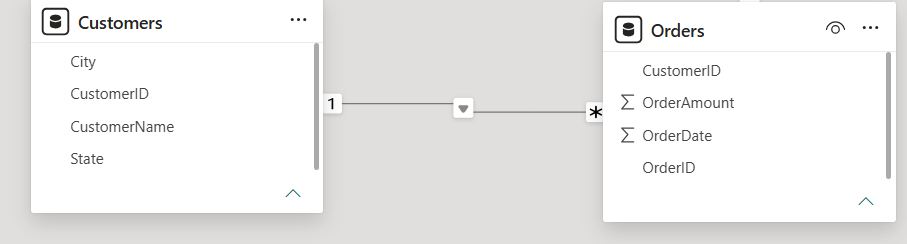
This is where many Power BI users go wrong. If you’re merging just to bring a lookup value into a fact table so you can slice by it, you often don’t need a merge at all. Create a relationship in Model view instead (Orders[CustomerID] → Customers[CustomerID]).
Use a relationship when: you want a clean star schema, the dimension table is reused by many fact tables, or the tables are large.
Use Merge when: you need to filter rows during load (anti joins), flatten small snowflake dimensions, reconcile data, or the key requires fuzzy matching.
A star schema with relationships is Microsoft’s recommended approach and usually gives you a smaller, faster model. For related modeling tips, see how to sum and group by multiple columns in Power BI.
Power Query vs DAX: Merge and Append Alternatives
You can also combine tables with DAX calculated tables:
Sales_All = UNION ( Sales_East, Sales_West )Orders_Customers = NATURALLEFTOUTERJOIN ( Orders, Customers )However, Power Query is usually the better choice. Data is shaped before it’s loaded, compression is better, and your transformations live in one place. Use DAX only when you need to combine tables that already exist in the model. Not sure where each tool fits? Read Power Query vs Power BI: what’s the difference.
Common Merge and Append Mistakes (and How to Fix Them)
Mismatched Column Names When Appending
Problem: You see extra columns full of nulls. Fix: Rename columns to match exactly (Power Query is case-sensitive: “Amount” ≠ “amount”) before appending.
Data Type Mismatches When Merging
Problem: The match summary says 0 rows match. Fix: Make sure both key columns use the same data type (e.g., both Text or both Whole Number). Also use Transform > Format > Trim and Clean to remove hidden spaces.
Duplicate Rows After a Merge
Problem: Your row count grows after a Left outer merge. Fix: In the lookup table, select the key column and choose Home > Remove Rows > Remove Duplicates before merging.
Loading Source Tables Twice
Problem: Your model is bloated. Fix: Right-click staging queries and clear Enable load.
Slow Refresh
Problem: Merges on large Excel or SharePoint sources take forever. Fix: Remove unneeded columns and filter rows before the merge, use relationships instead, or move the join to the source database. If you switch sources later, here’s how to change the data source in Power BI.
Real-World Example: Using Merge and Append Together
Here’s a common scenario for a U.S. retail company:
- Append the monthly sales files (Jan–Dec) from a SharePoint folder into one Sales table.
- Merge Sales with a Store table (Left outer on StoreID) to bring in State and Region.
- Merge Sales with Store again using Left anti to create an audit table of sales with invalid Store IDs.
- Load the final tables and build visuals. Add slicers by Region and State (see Power BI filter vs slicer, and how to remove blank values from a slicer if unmatched rows show up as blanks).
Conclusion
The choice between Merge and Append in Power BI comes down to one question: do you need more rows or more columns? If your tables share the same structure and you need more rows, use Append. If your tables share a key and you need more columns, use Merge. And before you merge, ask whether a simple relationship would do the job better.
Master these two features, and you’ll build cleaner, faster Power BI reports. For more step-by-step Power BI, SharePoint, and Power Platform tutorials, browse the Power BI tutorials on EnjoySharePoint.
If you’re building out the rest of your report, these guides pick up where this one ends:
Frequently Asked Questions
What is the main difference between Merge and Append in Power BI?
Append stacks tables vertically to add rows, while Merge joins tables horizontally on a matching key to add columns. Append is like SQL UNION ALL; Merge is like SQL JOIN. Shape and combine data in Power BI Desktop.
Does Append remove duplicates in Power BI?
No. Append keeps every row from every table. To remove duplicates, select the columns afterward and choose Home > Remove Rows > Remove Duplicates.
Can I append tables with different columns?
Yes. Power Query matches columns by name. Columns that exist in only one table are kept, and missing values are filled with null.
Can I merge more than two tables at once in Power BI?
No. Merge Queries works on two tables at a time. To combine three tables, merge the first two, then merge the result with the third. Append, however, supports three or more tables in one step.
Which join kind should I use in Power BI Merge?
Use Left outer for most lookups, Inner to keep only matched rows, Full outer to reconcile two systems, and Left anti or Right anti to find unmatched records.
Is it better to merge tables or create relationships in Power BI?
For most reporting models, relationships in a star schema are better. They keep the model smaller and faster. Merge is best for data cleanup, anti joins, and flattening small lookup tables.
Why does my merge return null values?
Usually because key values don’t match exactly. Check that data types are the same, trim extra spaces, fix case differences, or turn on fuzzy matching.
Why did my row count increase after merging?
The right table has duplicate key values. Each duplicate creates an extra row. Remove duplicates on the key column in the lookup table before merging.
What is the difference between Append Queries and Append Queries as New?
Append Queries modifies the selected query. Append Queries as New creates a separate query and leaves the originals unchanged, which is safer and easier to maintain.
Can I use Merge and Append in Power BI Service?
Yes. Dataflows Gen2 in Microsoft Fabric and Power Query Online in the Power BI service offer the same Merge queries and Append queries options under the Home tab’s Combine group.

I have worked with Microsoft technologies for more than 18 years, including SharePoint, Microsoft 365 and the Power Platform (Power Apps, Power Automate and Power BI), at companies like HP, TCS and KPIT. I started EnjoySharePoint in 2011 to share the solutions I build in real projects with readers in the United States, Canada, the United Kingdom, Australia, New Zealand and beyond. Microsoft has recognized this work with the Microsoft MVP award 13 times since 2014.