
When I build reports for clients, the data almost never comes in one clean table. Sales sit in one file, product details in another, and region information lives in a SharePoint list. To report on all of it together, I need to merge tables in Power BI.
In this tutorial, I’ll show you exactly how to merge tables in Power BI using Merge Queries in Power Query. We’ll cover every join kind, merging on multiple columns, fuzzy matching, the M code behind the scenes, and the common mistakes that break merges.
Quick answer: In Power BI Desktop, select Transform data, pick your main table, and choose Home > Merge Queries (or Merge Queries as New). Select the second table, click the matching key column in both tables, pick a join kind such as Left Outer, select OK, and then expand the new column to add the fields you need.
What Does “Merge Tables” Mean in Power BI?
Merging tables in Power BI means joining two tables side by side based on a matching column (a key). It works just like a SQL JOIN or a VLOOKUP in Excel.
For example, if a Sales table has a ProductID column and a Products table also has ProductID, you can merge them to bring ProductName and Category into the Sales table.
Merging happens in Power Query Editor, before the data is loaded into the model. If you’re unsure where Power Query ends and Power BI begins, read Power Query vs Power BI.
Merge vs Append – quick difference
- Merge = adds columns from another table (joins horizontally).
- Append = adds rows from another table (stacks vertically).
Sample Data Used in This Tutorial
I’ll use two simple tables. If your data lives in a SharePoint list instead of Excel, see how to build a Power BI report from a SharePoint list.
Download the sample Excel file to follow along. It contains the two tables used in this tutorial: Sales and Products.
Sales table
| OrderID | ProductID | Region | Quantity | SalesAmount |
|---|---|---|---|---|
| 1001 | P01 | East | 5 | 2500 |
| 1002 | P02 | West | 3 | 900 |
| 1003 | P03 | North | 2 | 1600 |
| 1004 | P05 | South | 7 | 1400 |
Products table
| ProductID | ProductName | Category | UnitPrice |
|---|---|---|---|
| P01 | Laptop | Electronics | 500 |
| P02 | Mouse Pad | Accessories | 300 |
| P03 | Monitor | Electronics | 800 |
| P04 | Keyboard | Accessories | 150 |
Notice that P05 exists only in Sales and P04 exists only in Products. That will help us see how each join kind behaves.
How to Merge Tables in Power BI – Step by Step
Let’s see how to merge the tables in Power BI.
Step 1: Load Both Tables into Power BI Desktop
- Open Power BI Desktop.
- Go to Home > Get Data and choose your source (Excel, SharePoint list, SQL Server, etc.). You can always change the data source in Power BI later.
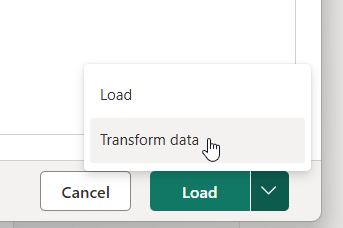
- Select both the Sales and Products tables and click Transform Data.
Step 2: Open Power Query Editor
Clicking Transform Data opens the Power Query Editor. You’ll see both queries listed in the Queries pane on the left.
![Power Query Editor Queries [2] pane listing the Sales and Products queries with Products selected](https://www.enjoysharepoint.com/wp-content/uploads/2026/10/Power-Query-Merge-Queries.jpg "Power Query Merge Queries")
Step 3: Choose Merge Queries or Merge Queries as New
- Select the Sales query (this will be your left/primary table).
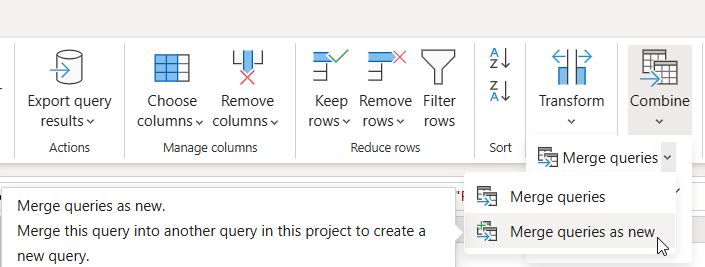
- On the Home tab, in the Combine group, click the Merge Queries dropdown.
- Choose one of the two options:
- Merge Queries – merges into the selected (Sales) table.
- Merge Queries as New – creates a brand-new third query and keeps the originals untouched.
I usually pick Merge Queries as New while testing, because it keeps the source tables clean.
Step 4: Select the Tables and Matching Columns
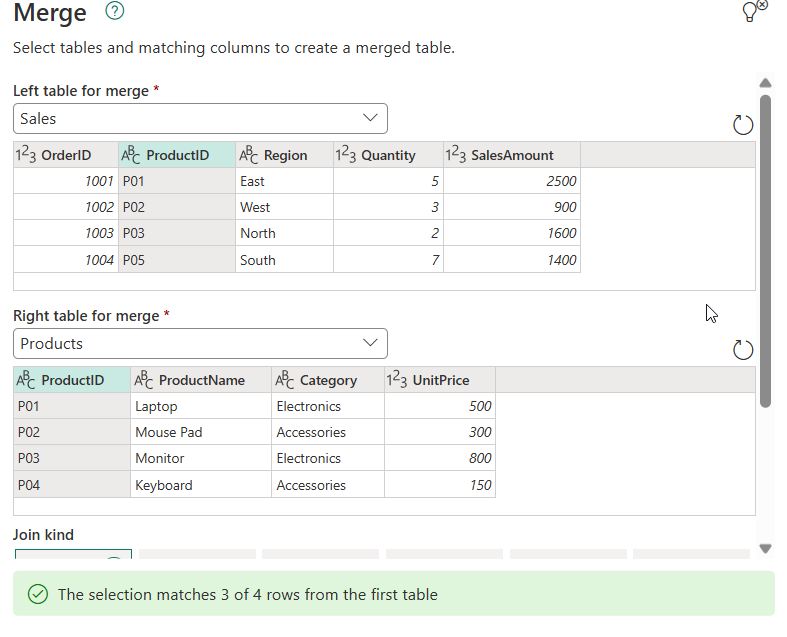
The Merge dialog box opens.
- The top table is Sales (already selected).
- From the second dropdown, select Products.
- Click the ProductID column in the Sales table.
- Click the ProductID column in the Products table.
Both selected columns become highlighted. At the bottom, Power BI shows how many rows matched, e.g. “The selection matches 3 of 4 rows from the first table.”
Step 5: Pick the Join Kind
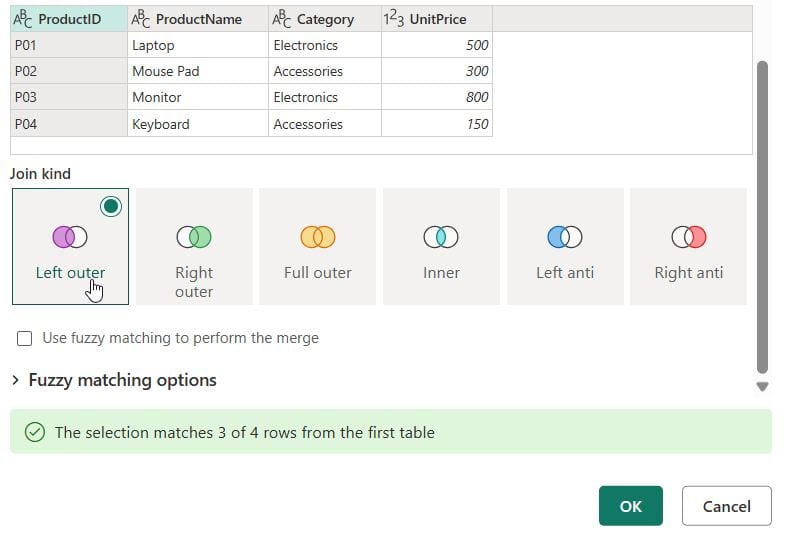
From the Join Kind dropdown, select Left Outer (all from first, matching from second). This is the default and the most commonly used. Click OK.
Step 6: Expand the Merged Table Column
After you click OK, where you see the result depends on the option you picked in Step 3:
- Merge Queries as New – a new query called Merge1 appears in the Queries pane. Click it. It contains all the Sales columns.
- Merge Queries – the result is added to the Sales query itself.
Either way, scroll to the far right of the data preview. You will see one extra column named Products (Power Query names it after the second table you merged with). This is not your original Products table – that table stays unchanged.
Tip: Right-click Merge1 and choose Rename to give it a meaningful name, such as SalesWithProducts.
Each cell in this new column shows the word Table. That cell holds the matching row(s) from the Products table for that order. For example, the cell for order 1001 (ProductID P01) contains the Laptop row. For order 1004 (P05), the inner table is empty because there is no match.
You cannot use this nested column directly in reports, so you need to expand it. Expanding pulls the product columns out of the nested table and adds them as normal columns in the Sales table:
- Click the expand icon on the Products column header. It is the small icon with two arrows pointing left and right (⇆), on the right side of the header cell. Can’t see it? Select the Products column, then go to Transform > Structured Column > Expand.
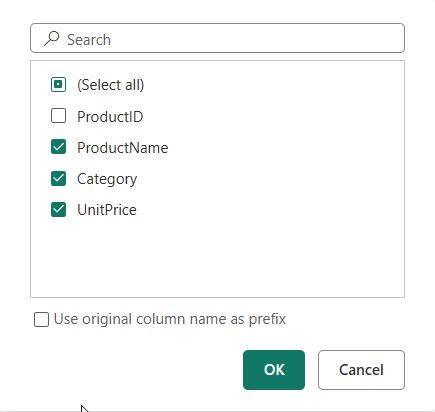
- Choose Expand, then check only the columns you need –
ProductName,Category,UnitPrice. - Uncheck Use original column name as prefix to keep column names clean.
- Click OK.
Step 7: Review the Result and Close & Apply
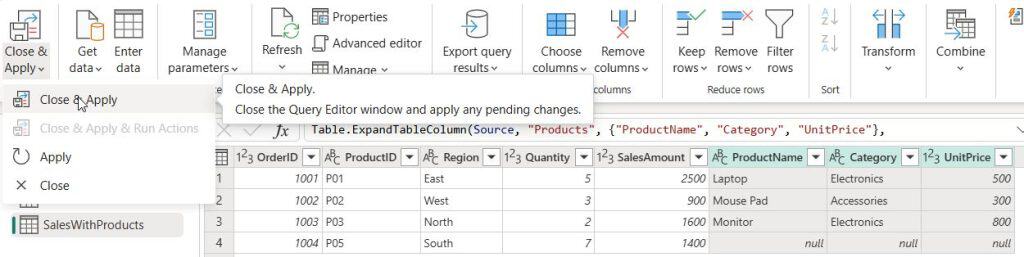
The merged query (Merge1, or Sales if you used Merge Queries) now includes the product details next to each order.
| OrderID | ProductID | Region | Quantity | SalesAmount | ProductName | Category | UnitPrice |
|---|---|---|---|---|---|---|---|
| 1001 | P01 | East | 5 | 2500 | Laptop | Electronics | 500 |
| 1002 | P02 | West | 3 | 900 | Mouse Pad | Accessories | 300 |
| 1003 | P03 | North | 2 | 1600 | Monitor | Electronics | 800 |
| 1004 | P05 | South | 7 | 1400 | null | null | null |
Order 1004 shows null because P05 doesn’t exist in Products. Click Home > Close & Apply to load the data.
Understanding the 6 Join Kinds in Power BI Merge Queries
Choosing the right join kind is the most important decision when you merge tables in Power BI. If unmatched rows later show up as (Blank) in a slicer, here’s how to remove blank values from a slicer.
| Join Kind | What It Returns | Rows in Our Example |
|---|---|---|
| Left Outer | All rows from first table + matching from second | 1001, 1002, 1003, 1004 |
| Right Outer | All rows from second table + matching from first | P01, P02, P03, P04 |
| Full Outer | All rows from both tables | 1001–1004 + P04 |
| Inner | Only matching rows in both | 1001, 1002, 1003 |
| Left Anti | Rows only in first table (no match) | 1004 (P05) |
| Right Anti | Rows only in second table (no match) | P04 |
When to use each join kind
- Left Outer – Lookups. Add details to a fact table without losing any rows.
- Inner – Keep only clean, fully matched records.
- Full Outer – Reconciliation reports where you need everything from both sides.
- Left Anti – Find orphan records, e.g. sales with an invalid ProductID. Great for data-quality checks.
- Right Anti – Find products that were never sold.
- Right Outer – Rarely needed; you can usually swap the table order and use Left Outer instead.
How to Merge Tables in Power BI on Multiple Columns
Sometimes one column isn’t unique enough. For example, a RegionSales table and a Targets table both have one row per Region per Year. Region alone repeats, so you need to match on both Region and Year.
Download the sample Excel file for this section and the fuzzy matching section below. It contains the RegionSales, Targets, OrdersFuzzy and Products tables.
RegionSales table
| Region | Year | SalesAmount |
|---|---|---|
| East | 2025 | 12000 |
| East | 2026 | 15000 |
| West | 2025 | 9000 |
| West | 2026 | 11000 |
| North | 2025 | 7000 |
| North | 2026 | 8500 |
Targets table
| Region | Year | Target |
|---|---|---|
| East | 2025 | 11000 |
| East | 2026 | 16000 |
| West | 2025 | 10000 |
| West | 2026 | 10500 |
| North | 2025 | 7500 |
| North | 2026 | 9000 |
Load both tables into Power Query, select RegionSales, and follow these steps:
- Open Merge Queries.
- In the first table, click Region, then Ctrl + click Year.
- In the second table, click Region, then Ctrl + click Year – in the same order.
- Small numbers (1, 2) appear on the headers to show the pairing.
- Choose the join kind and click OK.
Tip: The selection order must match in both tables. If you pick Region→Year on top and Year→Region below, the merge will fail to match.
If you only need to join text from two columns in the same row instead of joining tables, see Power BI combine columns from two tables.
How to Use Fuzzy Matching When Merging Tables in Power BI
Real-world data has typos – “Mouse Pad”, “MousePad”, “mouse pad “. Exact merges miss these. Fuzzy matching fixes that.
In the same sample file, the OrdersFuzzy table has product names typed slightly differently from the Products table (lowercase, missing or extra spaces). An exact merge on ProductName matches 0 rows.
OrdersFuzzy table
| OrderID | ProductName | Quantity |
|---|---|---|
| 2001 | laptop | 2 |
| 2002 | MousePad | 4 |
| 2003 | Monitor | 1 |
| 2004 | Key board | 3 |
Select OrdersFuzzy, open Merge Queries, choose Products as the second table, select ProductName in both, and then:
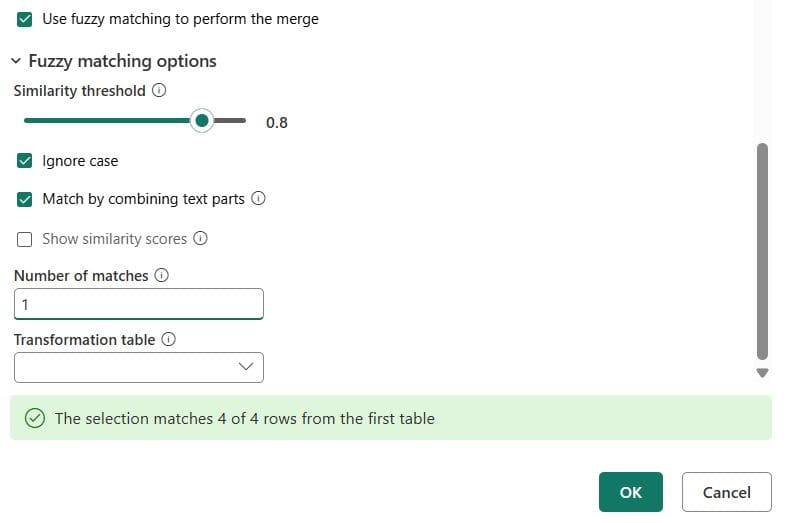
- In the Merge dialog, check Use fuzzy matching to perform the merge.
- Expand Fuzzy matching options:
- Similarity threshold – 0 to 1 (default 0.8). Lower = looser matches.
- Ignore case – treat “laptop” and “Laptop” as the same.
- Match by combining text parts – treat “Mouse Pad” and “MousePad” as the same.
- Maximum number of matches – limit duplicates.
- Transformation table – map known values, e.g. “NY” → “New York”.
- Click OK.
Fuzzy matching only works on text columns. Use it carefully – a low threshold can create wrong matches.
The M Code Behind Merge Queries
Every merge generates M code. Open View > Advanced Editor to see it:
let
    Source = Table.NestedJoin(
        Sales, {"ProductID"},
        Products, {"ProductID"},
        "Products",
        JoinKind.LeftOuter
    ),
    #"Expanded Products" = Table.ExpandTableColumn(
        Source, "Products",
        {"ProductName", "Category", "UnitPrice"},
        {"ProductName", "Category", "UnitPrice"}
    )
in
    #"Expanded Products"
Available JoinKind values: LeftOuter, RightOuter, FullOuter, Inner, LeftAnti, RightAnti.
For a fuzzy merge, Power Query uses Table.FuzzyNestedJoin instead.
Merge Queries vs Append Queries vs Relationships
| Feature | Merge Queries | Append Queries | Model Relationships |
|---|---|---|---|
| Direction | Adds columns | Adds rows | Links tables, no physical join |
| Where | Power Query | Power Query | Model view |
| Result | One wider table | One longer table | Separate related tables |
| Best for | Lookups, flattening small dimensions | Combining monthly files, same structure | Star schema, large models |
For a deeper side-by-side look, read merge vs append in Power BI, or see how to append tables in Power BI when you need more rows instead of more columns.
My honest advice: don’t merge everything into one giant table. For large fact and dimension tables, a relationship in the Model view is usually faster and keeps your model smaller. Merge when you need the column physically in the table – for example, to filter rows, calculate a custom column, or apply Power BI row-level security on a flattened table.
Practical Example: Bring Category into Sales and Build a Visual
After merging, the Category column is now inside the Sales table. You can:
- Create a Power BI sum measure like
Total Sales = SUM(Sales[SalesAmount]). - Add a Power BI clustered column chart with Category on the X-axis and Total Sales on the Y-axis.
- Add a Power BI slicer on Region to filter the chart.
You can also sum and group by multiple columns in Power BI to summarize the merged data further.
Common Merge Errors and How to Fix Them
1. “The selection matches 0 rows”
- Data types differ (Text vs Whole Number). Make both key columns the same type.
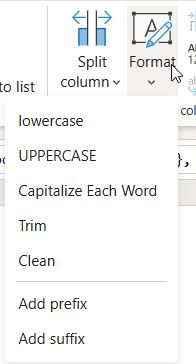
- Hidden spaces – use Transform > Format > Trim and Clean on both keys.
- Case differences – Power Query merges are case-sensitive. Use Format > UPPERCASE on both sides or use fuzzy matching with Ignore case.
2. Duplicate rows after merging
The second table has duplicate keys. Select the key column in the lookup table and use Home > Remove Rows > Remove Duplicates before merging.
3. Merge is very slow
- Remove unnecessary columns before merging.
- Filter rows early.
- With SQL sources, keep steps foldable so the join runs on the server (right-click a step > View Native Query).
- Consider a model relationship instead.
4. New columns don’t appear after refresh
The expand step hard-codes column names. Re-open the expand step and check the new columns.
If your merged data comes from online sources, set up Power BI schedule refresh so the merge runs automatically.
Best Practices for Merging Tables in Power BI
- Use Merge Queries as New when experimenting.
- Always trim, clean and match data types on key columns.
- Remove duplicates from the lookup table.
- Expand only the columns you need.
- Rename merge steps clearly in Applied Steps (e.g. “Merged with Products”).
- Prefer relationships for large star-schema models.
- Use Left Anti joins for data-quality checks.
Conclusion
Now you know how to merge tables in Power BI using Merge Queries in Power Query. We covered the step-by-step process, all six join kinds, merging on multiple columns, fuzzy matching, the M code behind it, and how to fix the most common errors.
My rule of thumb: merge for lookups and data cleaning, use relationships for large models. Get the key columns clean first, and your merges will just work.
For more step-by-step guides, explore the full list of Power BI tutorials on EnjoySharePoint.
Once your tables are merged, these tutorials help you model and report on the result:
Frequently Asked Questions
How do I merge two tables in Power BI?
Open Power Query Editor, select the first table, click Home > Merge Queries, choose the second table, select the matching column in both, choose a join kind, click OK, then expand the new column. Merge queries overview on Microsoft Learn.
What is the difference between Merge Queries and Merge Queries as New?
Merge Queries modifies the selected table. Merge Queries as New creates a separate new query and leaves both original tables unchanged.
Can I merge more than two tables in Power BI?
Yes, but one at a time. Merge Table A with B, then merge the result with C.
Can I merge tables using DAX instead of Power Query?
Yes, DAX functions like NATURALLEFTOUTERJOIN, NATURALINNERJOIN and LOOKUPVALUE exist, but Power Query merges are usually better for performance and maintainability.
Why does my merge show null values?
Those rows had no match in the second table. Check for typos, spaces, or data type mismatches in the key columns.
Is Power Query merge case-sensitive?
Yes. “p01” and “P01” won’t match unless you convert the case or use fuzzy matching with Ignore case.

I have worked with Microsoft technologies for more than 18 years, including SharePoint, Microsoft 365 and the Power Platform (Power Apps, Power Automate and Power BI), at companies like HP, TCS and KPIT. I started EnjoySharePoint in 2011 to share the solutions I build in real projects with readers in the United States, Canada, the United Kingdom, Australia, New Zealand and beyond. Microsoft has recognized this work with the Microsoft MVP award 13 times since 2014.