
A Power BI column chart shows one vertical column per category, and the height of each column is its value. To create one, select a column chart in the Visualizations pane, add a category such as Region to X-axis and a number such as Revenue to Y-axis.
At Contoso, the sales manager asked me for a quick view of revenue by region, then by region and product category, then revenue next to units sold. Each of those needs a different column chart type. In this tutorial, I’ll show how to build each one in Power BI Desktop, when to pick which, and how to format and fix them.
Quick answer: In Power BI Desktop, select Clustered column chart in the Visualizations pane. Put a category in X-axis and a measure in Y-axis. Add a second category to Legend to split the columns, and choose Stacked, Clustered or 100% stacked column depending on whether you want totals, side-by-side values or shares. Format it under Format visual > Visual > Columns.
What is a column chart in Power BI?
A column chart compares values across categories with vertical bars. It works best for a handful of categories, such as regions, products or months. A bar chart shows the same thing with horizontal bars, which is easier to read when the category names are long or there are many of them. For that version, see how to create a bar chart in Power BI.
Use a column chart when the question is “which one is bigger?” or “how did it change from month to month?”. If you need to show parts of a whole for a single total, a pie or donut chart is often clearer.
Column chart types in Power BI
Power BI Desktop has three column chart visuals, plus two combo charts that add a line:
| Type | What it shows | Use it when |
|---|---|---|
| Clustered column | Columns side by side for each legend item | You compare the segments with each other |
| Stacked column | Segments stacked into one column per category | You care about the total and its parts |
| 100% stacked column | Every column is 100%, split by share | You compare the mix, not the size |
| Line and clustered column | Clustered columns with a line on its own axis | Two measures with different scales |
| Line and stacked column | Stacked columns with a line | A total split by segment, plus a trend or target |
Two related visuals are worth knowing too. A ribbon chart in Power BI ranks the segments in each column, and a Power BI waterfall chart shows how a starting value rises and falls to an end value.
How to create a column chart in Power BI
I’m using a Sales table with 600 orders from 2025 and 2026, with Region, Category, Units and Revenue in USD columns.
- Open your report in Power BI Desktop and select an empty spot on the page.
- In the Visualizations pane, select Clustered column chart. An empty chart appears.
- In the Data pane, select Region. It goes to X-axis.
- Select Revenue. It goes to Y-axis as Sum of Revenue.

With one measure and no legend, a clustered column chart and a stacked column chart look exactly the same. The type only matters once you add a field to Legend or a second measure to Y-axis.
You can also drop more than one field in X-axis, such as Year and Region. That creates a hierarchy, and the drill arrows above the chart let you move between the levels.
Stacked vs. clustered vs. 100% stacked column chart
To compare the three, I built each type with the same fields: Region in X-axis, Revenue in Y-axis and Category in Legend.
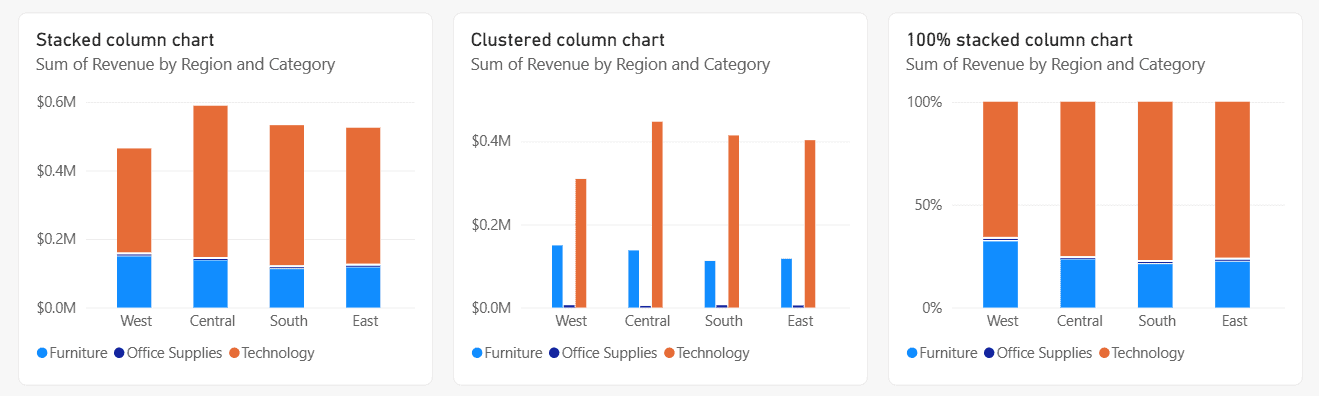
- Stacked column (left) answers which region sells the most overall. Central is the tallest, at about $0.59 million.
- Clustered column (middle) compares the categories directly. Technology is by far the biggest in every region, while Office Supplies is so small its columns barely show.
- 100% stacked column (right) answers what share each category has. Furniture makes up roughly a third of West’s revenue, but less in the other regions.
For the full steps, total labels and legend options, see how to create a stacked column chart in Power BI and the clustered column chart in Power BI.
You can switch between types at any time. Select the chart and pick another column visual in the Visualizations pane, and your fields stay in place.
Show two measures with a line and column chart
You can put several measures in Y-axis of a clustered column chart, but they share one scale. Revenue in the hundreds of thousands next to units in the low thousands makes the units columns almost invisible. A combo chart fixes that with a second axis.
- Select Line and clustered column chart in the Visualizations pane.
- Add Region to X-axis and Revenue to Column y-axis.
- Drag Units to Line y-axis. Checking its box adds it to the columns instead.
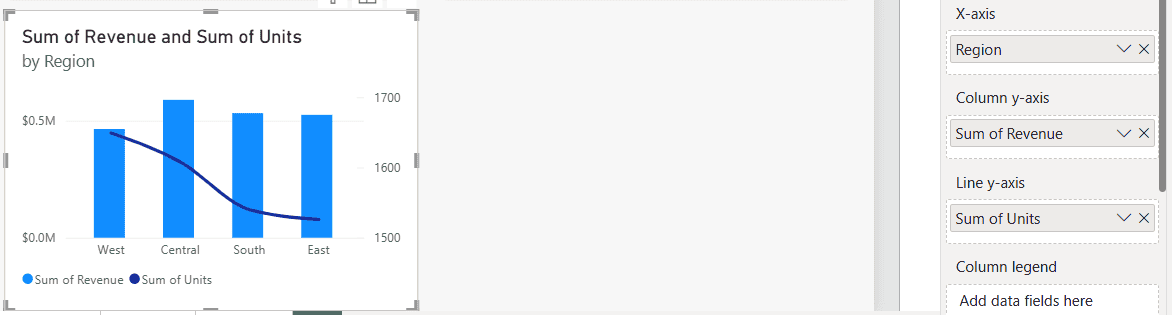
The units line now has its own axis on the right, from 1,500 to 1,700. Power BI shows the secondary axis automatically when the two ranges don’t overlap. For more options, see how to create and use a Power BI combo chart.
Format a Power BI column chart
Select the chart and open Format visual. The Visual tab holds the chart settings and the General tab holds the title, size and position. These are the settings I change most often:
- Columns: column color, transparency, border and spacing. Under Apply settings to, pick one category or series to color it on its own.
- Data labels: shows the value on each column. For stacked charts, Total labels adds the column total on top.
- X-axis and Y-axis: font, title, and the Y-axis range. Set a fixed minimum of 0 so small differences don’t look huge.
- Legend: position and title, or turn it off when there’s only one series.
- Title on the General tab: replace “Sum of Revenue by Region” with a sentence your readers understand.
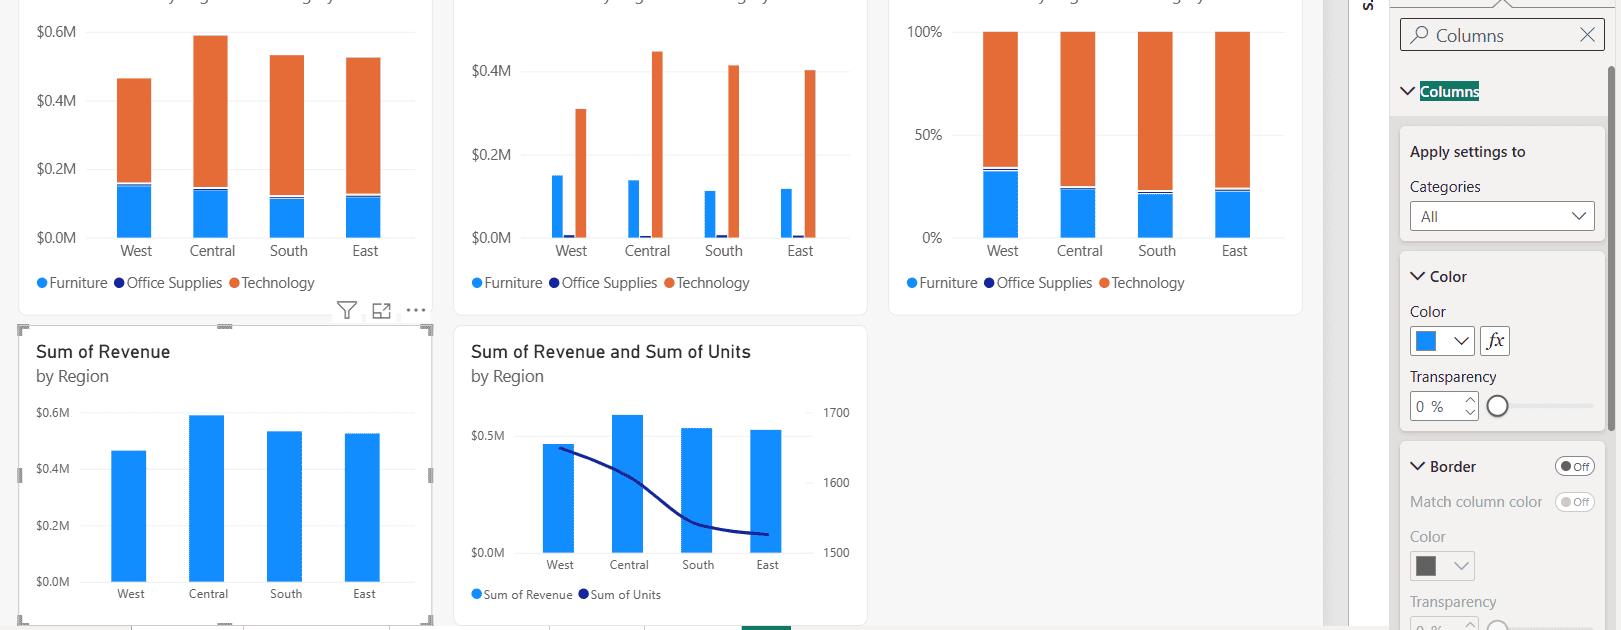
The fx button next to Color opens conditional formatting, where you can color columns by rules, a gradient or a color measure. I explain each option in conditional formatting in a Power BI stacked column chart.
Sort the columns
Power BI usually sorts a new column chart by its value, highest first. To change it, select More options (…) on the chart, point to Sort by, choose the field, and select Sort ascending or Sort descending.
For months or custom orders such as Small, Medium, Large, sort the column itself with Column tools > Sort by column. The same ideas apply to bar charts, as shown in how to sort a stacked bar chart in Power BI.
Small multiples and data point limits
Add a field to Small multiples to repeat the chart once per value, for example one small column chart per year. The grid starts at 2 by 2 and can go up to 6 by 6. Total labels and the zoom slider are turned off while small multiples are used.
Column charts also have data limits. With a categorical X-axis, Power BI loads 500 categories at a time and shows up to 60 legend series. If columns or legend items seem to be missing, filter the chart down or use a Top N filter.
Common problems and fixes
- The Legend well won’t accept a field: Y-axis has more than one measure. Charts with multiple measures don’t support a legend, so remove one measure.
- One series is too small to see: it’s on the same scale as a much bigger one. Use a line and clustered column chart and move it to the line axis.
- The months are in alphabetical order: sort the month name column by a month number column.
- Total labels are missing: they’re only for stacked charts, and they’re off while small multiples are used.
- The columns look too thin: reduce the space between categories under Columns, or make the visual narrower.
Ready to try other Power BI visuals? These are a good next step:
Frequently Asked Questions
How do I create a column chart in Power BI?
Select a column chart in the Visualizations pane, then add a category to X-axis and a measure to Y-axis. Microsoft’s column chart documentation lists the valid field combinations.
What is the difference between a stacked and a clustered column chart?
A stacked column chart puts the legend segments on top of each other in one column, so you see the total. A clustered column chart puts them side by side, so you compare the segments.
Can a Power BI column chart have two Y-axes?
Not the plain column chart. Use a line and clustered column or line and stacked column chart, and put the second measure in Line y-axis.
Why can’t I add a legend to my column chart?
The chart has more than one measure in Y-axis. Column charts with multiple measures don’t support a legend.
How do I change the space between columns in Power BI?
Select the chart, open Format visual > Visual > Columns and adjust the spacing under its layout settings.

I have worked with Microsoft technologies for more than 18 years, including SharePoint, Microsoft 365 and the Power Platform (Power Apps, Power Automate and Power BI), at companies like HP, TCS and KPIT. I started EnjoySharePoint in 2011 to share the solutions I build in real projects with readers in the United States, Canada, the United Kingdom, Australia, New Zealand and beyond. Microsoft has recognized this work with the Microsoft MVP award 13 times since 2014.