
To use conditional formatting in a Power BI stacked column chart, select the chart, go to Format visual > Visual > Columns > Color and select the fx button. Then choose Rules, Gradient or Field value, and it works whether or not the chart has a legend.
At Contoso, the sales manager wanted two things from one revenue chart: the same fixed colors for each product category in every report, and any region under its $500,000 target to stand out in red. In this tutorial, I’ll do both in Power BI Desktop and cover the border colors, the bar chart version and the common problems.
Quick answer: Select the chart and open Format visual > Columns > Color > fx. With a legend, use Field value and a measure such as SWITCH(SELECTEDVALUE(Sales[Category]), "Technology", "#1F4E79", ...) to color each segment. Without a legend, use Rules on the value, for example red under 500,000. Turn on Border > Match column color so borders follow.
Which conditional formatting option should you use?
The fx dialog has three format styles. The right one depends on whether your chart has a field in Legend. If you’re new to the dialog itself, conditional formatting in Power BI explains it across all visuals.
| Format style | Colors by | Best for |
|---|---|---|
| Rules | Value ranges you type, such as 0 to 500,000 | Targets and thresholds, charts without a legend |
| Gradient | A color scale from the lowest to the highest value | Showing size at a glance |
| Field value | A measure that returns a color code | Fixed colors per legend item, complex logic |
Here’s the part many older tutorials get wrong: they say fx disappears once a field is in Legend. That’s no longer true. In current Power BI Desktop, the dialog opens as Color – Series when the chart has a legend, and as Color – Categories when it doesn’t.
My sample chart
I’m using a Sales table with 600 orders from 2025 and 2026. The chart has Region in X-axis, Revenue in Y-axis and Category in Legend. If you still need to build it, see how to create a stacked column chart in Power BI.
Color each legend item with a measure (Field value)
Power BI picks the segment colors from the theme, so they can change when someone edits the report or switches themes. A color measure locks them in, and you can reuse it on every chart that has Category in the legend.
Step 1: Create the color measure
On the Home tab, select New measure and enter this DAX. It returns a hex color for each category, and gray for anything else:
Category Color =
SWITCH (
    SELECTEDVALUE ( Sales[Category] ),
    "Technology", "#1F4E79",
    "Furniture", "#5DADE2",
    "Office Supplies", "#F5B041",
    "#999999"
)
SELECTEDVALUE returns the category of the segment being drawn. If it’s new to you, see how to use SELECTEDVALUE in Power BI. Make sure the measure’s data type is Text, or it won’t appear in the dialog.
Step 2: Apply it with Field value
- Select the chart, then Format visual > Visual > Columns.
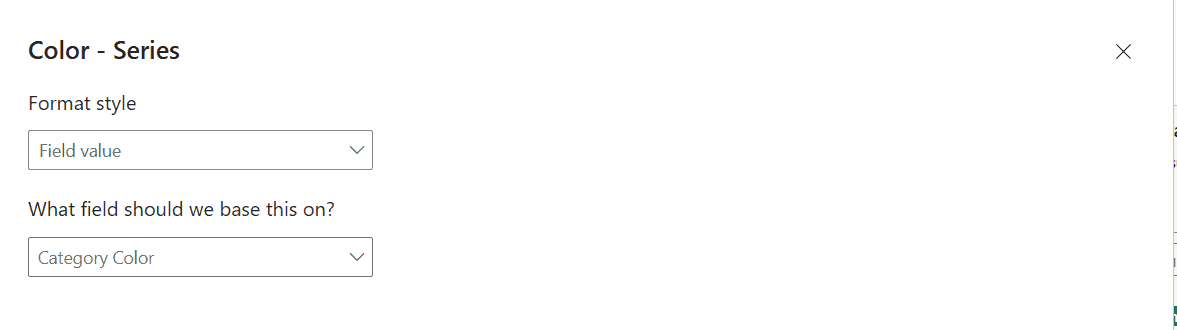
- Under Color, select fx. The Color – Series dialog opens.
- Set Format style to Field value.
- Under What field should we base this on?, expand Sales and select Category Color. Then select OK.
Every segment now uses its fixed color. Technology is dark navy, Furniture is light blue and Office Supplies is orange, and the legend updates to match.
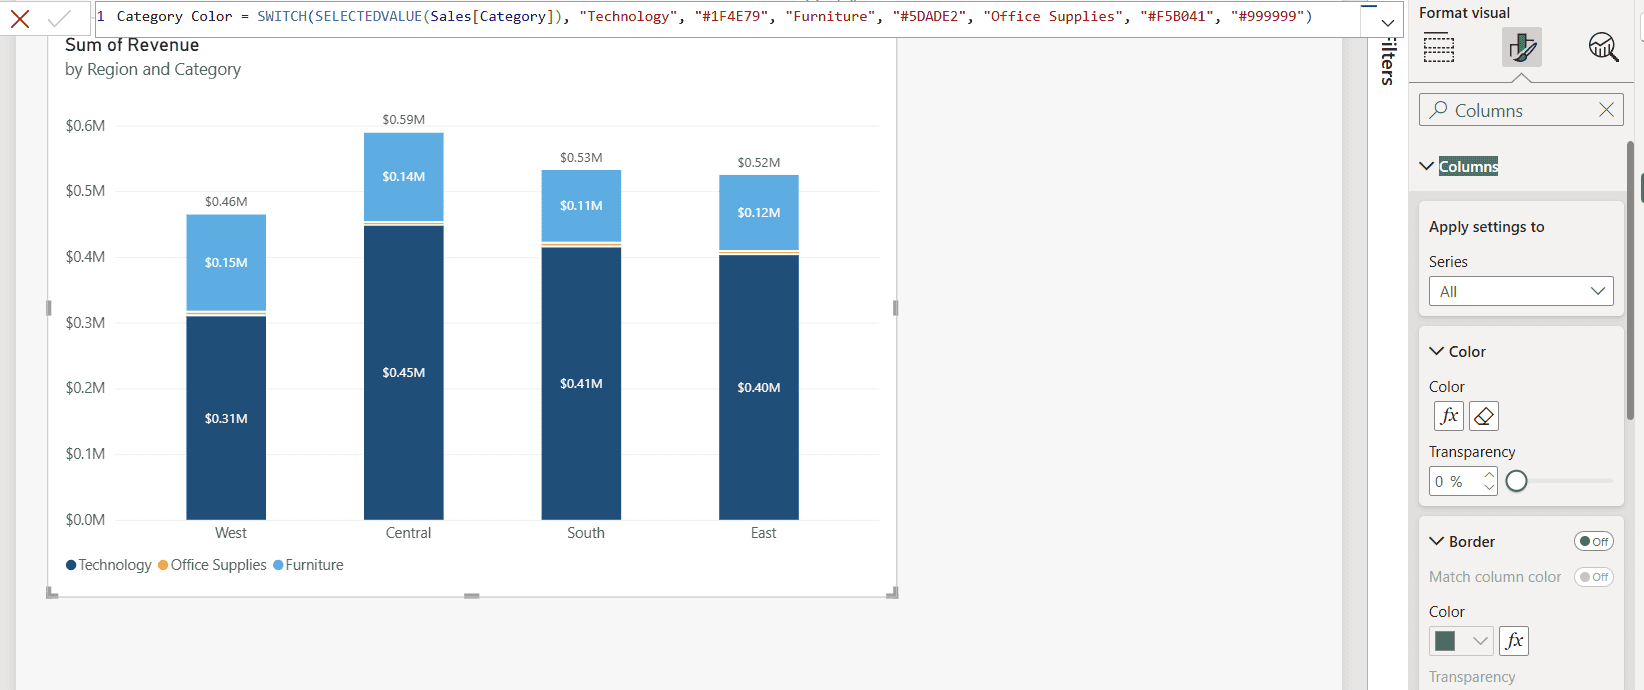
The Color card now shows the fx button and an eraser. Select the eraser to remove the conditional formatting and go back to the theme colors.
Color columns by value with Rules
Rules are the easiest way to flag targets. For this part, I removed Category from Legend, so each column is one region’s total revenue.
- Open Columns > Color > fx. Without a legend, the dialog is called Color – Categories.
- Set Format style to Rules.
- Under What field should we base this on?, pick Sum of Revenue. Summarization changes to Sum.
- First rule: If value >= 0 Number and < 500000 Number, then red.
- Select New rule. Second rule: >= 500000 and < 1000000, then navy. Select OK.
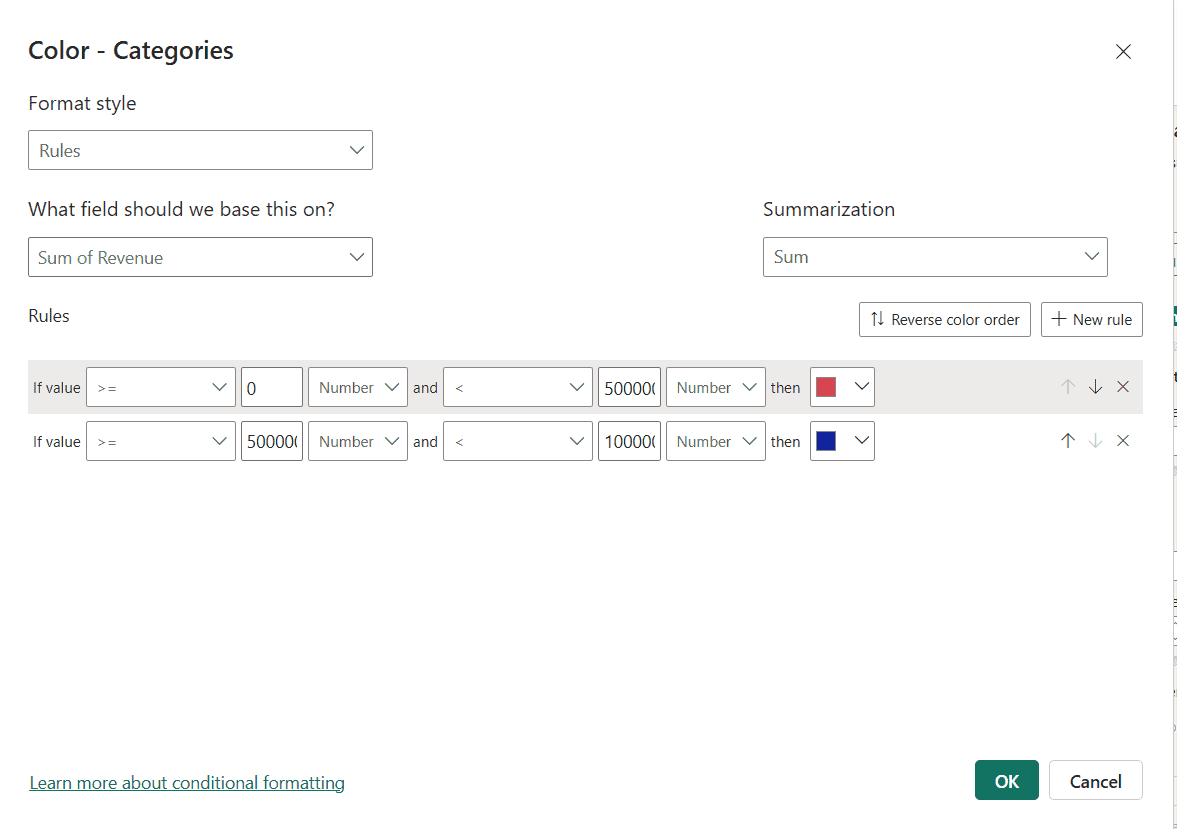
Watch the drop-down next to each number. New rules start as Percent, which means a percentage of the range, not the value itself. Switch it to Number when you type amounts like 500,000.
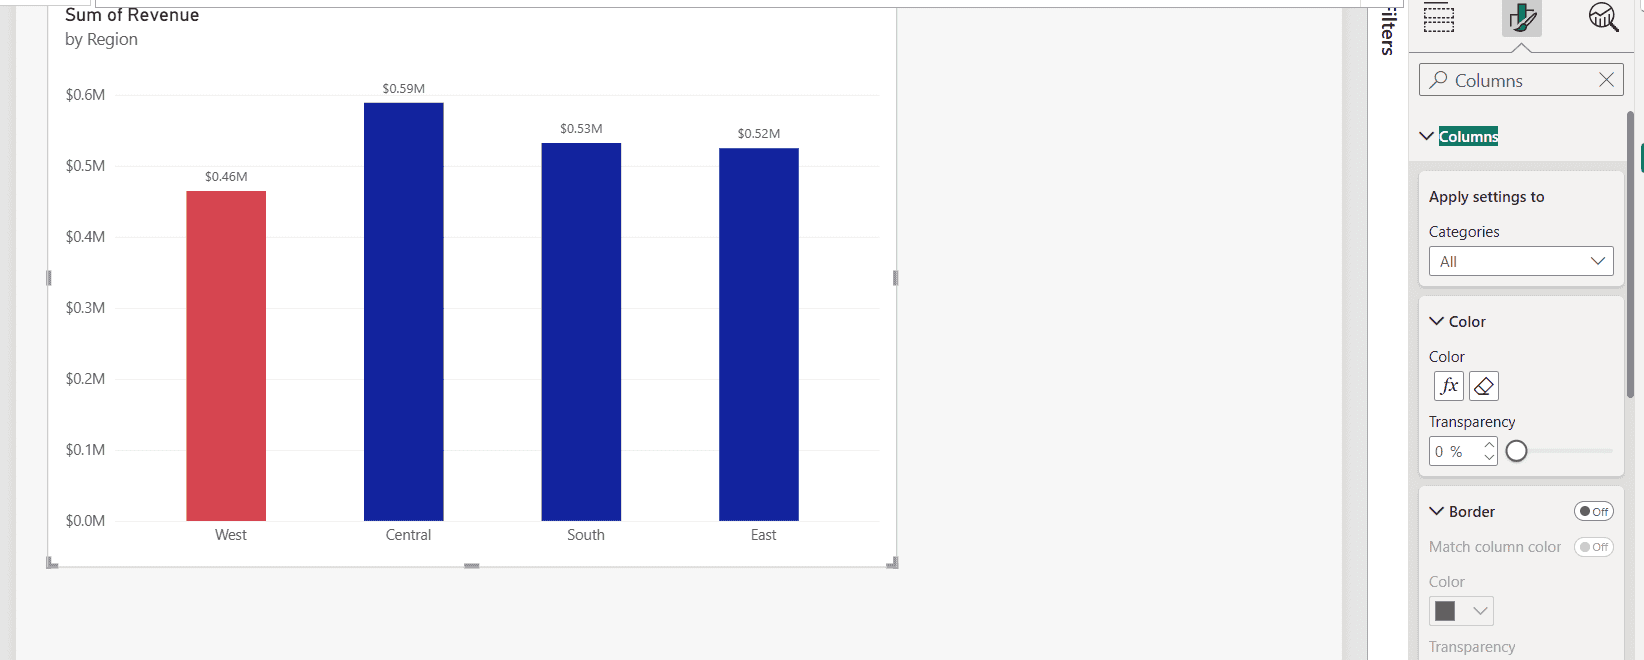
West, at $0.46 million, is the only region under target, so it’s red. If a value falls outside every rule, it keeps the default color, so make sure your rules cover the full range.
Use a gradient
Set Format style to Gradient and choose Sum of Revenue as the base field. Pick one color for the lowest value and one for the highest, and Power BI shades everything in between. Select Add a middle color for a three-color scale, such as red, yellow and green.
Gradients work best with many columns, such as months or products. With four regions, the shades are too close to tell apart, so I’d use Rules instead.
Use a measure for complex conditions
Rules can only test the one field you pick. When the color depends on more than that, put the logic in a measure and apply it with Field value, as in the first section. This measure adds an amber warning band just above the target:
Revenue Color =
VAR Rev = SUM ( Sales[Revenue] )
RETURN
    SWITCH (
        TRUE (),
        Rev < 500000, "#D9534F",
        Rev < 550000, "#F5B041",
        "#1F4E79"
    )
This one colors a region navy only when both revenue and units hit their targets, which answers the common question of formatting based on two columns:
Target Color =
IF (
    SUM ( Sales[Revenue] ) >= 500000
        && SUM ( Sales[Units] ) >= 2000,
    "#1F4E79",
    "#D9534F"
)
SWITCH(TRUE()) checks the conditions in order, so put the most specific one first. Field value accepts hex codes such as #1F4E79, and also color names such as red.
Conditional border colors
There’s no separate rule for borders. Instead, open Columns > Border, turn it On, and turn on Match column color. The border then follows each column’s conditional color, including the red for West.
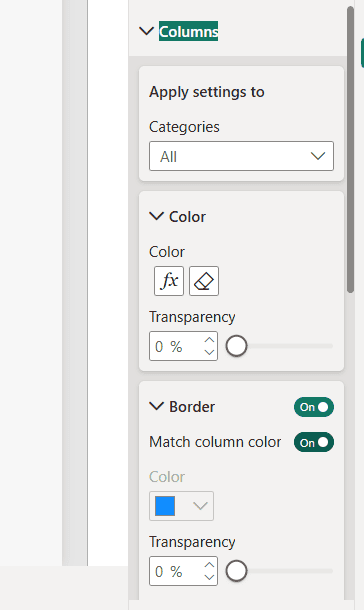
If you want a border that stands out from the fill, leave Match column color off and pick one fixed border color. A darker border with a lighter, more transparent fill also works well.
The same steps for a stacked bar chart
A stacked bar chart has the same color options, so everything above works the same way.
Select the bar chart, open the color setting on the Visual tab, select fx and pick a format style. For the other bar chart settings, see how to create a bar chart in Power BI, and to order the bars, see how to sort a stacked bar chart in Power BI.
Common problems and fixes
- The measure doesn’t appear under Field value: it must return text. Check that it returns values like “#1F4E79”, not numbers.
- Some columns keep the default color: the value falls outside every rule. Extend the last rule or add one for the remaining range.
- Rules don’t seem to work: the value type is set to Percent. Change it to Number.
- All segments have the same color: the measure doesn’t read the legend field. Use SELECTEDVALUE on the Legend column, as in Category Color.
- I want to remove the colors: select the eraser next to fx under Columns > Color.
The same fx dialog works on other visuals too, for example conditional formatting in a Power BI line chart and Power BI matrix conditional formatting.
For more ways to color your Power BI charts, try these next:
Frequently Asked Questions
Can I use conditional formatting on a stacked column chart with a legend?
Yes. In current Power BI Desktop, Columns > Color > fx opens a Color – Series dialog when the chart has a legend. Use Field value with a color measure, as described in Microsoft’s conditional formatting documentation.
Why is fx missing in my column chart?
Older versions of Power BI Desktop hid it when the chart had a legend. Update Power BI Desktop, or remove the field from Legend.
How do I color columns by a target value in Power BI?
Open Columns > Color > fx, choose Rules, base it on your value, and add one rule below the target and one above it. Set each rule’s value type to Number.
Can I change the border color of a column conditionally?
Yes. Turn on Columns > Border and Match column color. The border then follows the column’s conditional color.
Does conditional formatting work in a stacked bar chart?
Yes. A stacked bar chart has the same color options and the same fx dialog as a stacked column chart.

I have worked with Microsoft technologies for more than 18 years, including SharePoint, Microsoft 365 and the Power Platform (Power Apps, Power Automate and Power BI), at companies like HP, TCS and KPIT. I started EnjoySharePoint in 2011 to share the solutions I build in real projects with readers in the United States, Canada, the United Kingdom, Australia, New Zealand and beyond. Microsoft has recognized this work with the Microsoft MVP award 13 times since 2014.