
Our operations team wanted to know how long orders sat in the warehouse before shipping, which orders were still open, and how many shipped after their due date. Every one of those questions is a date difference, and in Power BI DATEDIFF answers most of them in one line.
In this tutorial, I’ll show you how to calculate the difference between two dates in Power BI: between two columns, between two tables, from today, in business days and as a measure. I’ll also show the blank-date problem that makes plain subtraction return numbers like -46,297, and how DATEDIFF avoids it.
Quick answer: Use DATEDIFF(<start date>, <end date>, <interval>), for example Days to Ship = DATEDIFF(Orders[Order Date], Orders[Ship Date], DAY) as a calculated column. The interval can be SECOND, MINUTE, HOUR, DAY, WEEK, MONTH, QUARTER or YEAR. For days from today, use TODAY() as one of the dates. For an average across many rows, use AVERAGEX(Orders, DATEDIFF(...)) in a measure.
DATEDIFF syntax and intervals
DATEDIFF(<Date1>, <Date2>, <Interval>)DATEDIFF returns the number of interval boundaries between Date1 and Date2. The result is positive when Date2 is later, and negative when Date1 is later.
| Interval | Counts | Example: 01/15/2026 to 03/02/2026 |
|---|---|---|
| DAY | Calendar days | 46 |
| WEEK | Week boundaries | 7 |
| MONTH | Month boundaries crossed | 2 |
| QUARTER | Quarter boundaries crossed | 0 |
| YEAR | Year boundaries crossed | 0 |
| HOUR / MINUTE / SECOND | For date/time values | 1,104 hours |
“Boundaries crossed” is the part that surprises people. DATEDIFF(DATE(2025,12,31), DATE(2026,1,1), YEAR) returns 1, even though the dates are one day apart, because a year boundary sits between them. Keep that in mind for ages and tenure, covered below.
DATEDIFF works in calculated columns, measures and calculated tables. If you’re new to the date functions it pairs with, see Power BI DAX date functions with examples.
The sample data
I’m using an OrderList table with 300 orders from 2026 (Order ID, Customer ID, Order Date, Ship Date and Due Date) and a CustomerList table with each customer’s Signup Date. The two tables are related on Customer ID. Eleven recent orders haven’t shipped yet, so their Ship Date is blank.
Example 1: Date difference between two columns
To get the number of days between the order date and the ship date for each order, add a calculated column. In Table view, select the table, choose Table tools > New column and enter:
Days to Ship = DATEDIFF(OrderList[Order Date], OrderList[Ship Date], DAY)Each row now shows how many days that order took. Change DAY to WEEK or MONTH for other units.
You’ll often see the same thing written as OrderList[Ship Date] - OrderList[Order Date]. It gives the same result for shipped orders, but look at what happens on the unshipped ones:
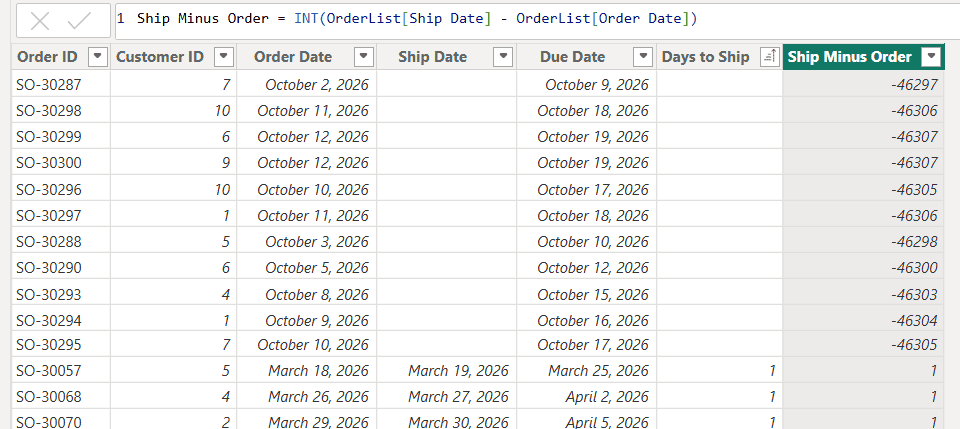
DATEDIFF returns blank when a date is missing. Subtraction treats the blank as day zero (December 30, 1899) and returns about -46,300 days. One of those rows in an average will wreck your numbers. That’s my main reason for using DATEDIFF instead of subtracting dates.
If you do need subtraction for other values, here’s how to subtract in a Power BI measure.
Example 2: Date difference between two tables
Signup Date lives in CustomerList, and Order Date lives in OrderList. Because the tables are related (many orders to one customer), a calculated column in OrderList can fetch the customer’s signup date with RELATED:
Days Since Signup =
DATEDIFF ( RELATED ( CustomerList[Signup Date] ), OrderList[Order Date], DAY )
RELATED works from the many side to the one side. Going the other way, from CustomerList to its orders, there are many dates per customer, so you need to pick one first, for example the first order:
Days to First Order =
DATEDIFF (
    CustomerList[Signup Date],
    CALCULATE ( MIN ( OrderList[Order Date] ) ),
    DAY
)
As a calculated column in CustomerList, CALCULATE turns the current customer row into a filter, so MIN returns that customer’s first order date.
Example 3: Date difference from today
To see how long each open order has been waiting, compare the order date with today’s date:
Days Open =
IF (
    ISBLANK ( OrderList[Ship Date] ),
    DATEDIFF ( OrderList[Order Date], TODAY (), DAY )
)
Shipped orders return blank, so only open orders show a number. The IF pattern is explained in how to use IF in a Power BI measure. For days left until a deadline, swap the order: DATEDIFF(TODAY(), OrderList[Due Date], DAY). Overdue orders then show a negative value.
One catch: in a calculated column, TODAY() is evaluated when the data refreshes, not when someone opens the report. If the dataset refreshes once a night, the numbers are as of that refresh. Put TODAY() in a measure if it must be current at view time.
Example 4: Business days between two dates (NETWORKDAYS)
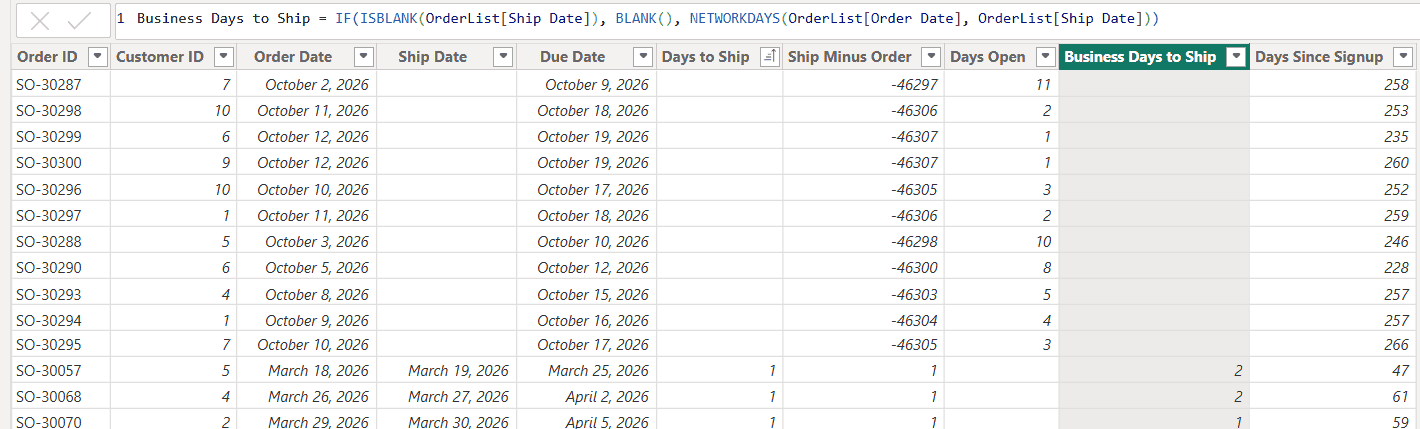
DATEDIFF counts calendar days. To skip weekends, use NETWORKDAYS:
Business Days to Ship =
IF (
    ISBLANK ( OrderList[Ship Date] ),
    BLANK (),
    NETWORKDAYS ( OrderList[Order Date], OrderList[Ship Date] )
)
Two things I noticed when testing this:
- NETWORKDAYS counts both the start and end day. An order placed on Wednesday, March 18 and shipped Thursday, March 19 shows 2 business days, while DATEDIFF shows 1. Subtract 1 if you want the same meaning as DATEDIFF.
- NETWORKDAYS doesn’t skip blanks. Without the ISBLANK check, my unshipped orders returned -33,070. Always guard it.
NETWORKDAYS also takes optional arguments for the weekend pattern and a list of holidays, for example NETWORKDAYS(start, end, 1, Holidays) where Holidays is a single-column table of dates.
Example 5: Average days as a measure
Calculated columns are fine per row, but reports usually need an average by customer, region or month. Use a measure with AVERAGEX, which runs DATEDIFF on each row and averages the results:
Avg Days to Ship =
AVERAGEX (
    OrderList,
    DATEDIFF ( OrderList[Order Date], OrderList[Ship Date], DAY )
)
I added two more measures for context:
Late Orders =
COUNTROWS ( FILTER ( OrderList, OrderList[Ship Date] > OrderList[Due Date] ) )

Open Orders =
CALCULATE ( COUNTROWS ( OrderList ), ISBLANK ( OrderList[Ship Date] ) )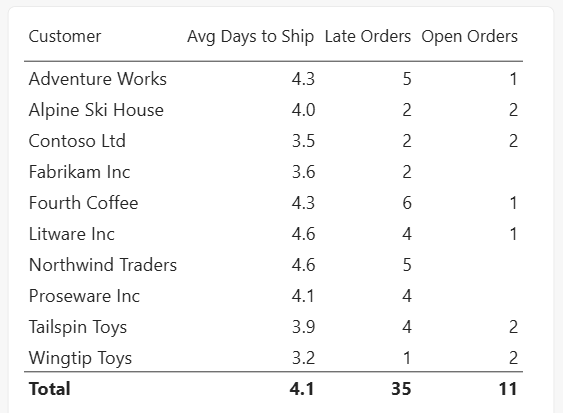
The average is 4.1 days. AVERAGEX skips the blank results from the 11 unshipped orders; if they counted as zero, the average would drop to 3.9. The same iterator pattern is explained in SUM vs SUMX in Power BI, and AVERAGEX vs AVERAGE covers the averaging functions.
Example 6: Months and years between two dates (age and tenure)
Because DATEDIFF counts boundaries, DATEDIFF(Birth Date, TODAY(), YEAR) adds a year on January 1, not on the birthday. For an exact age, subtract one if the birthday hasn’t happened yet this year:
Age =
VAR Birth = Employees[Birth Date]
VAR Today = TODAY ()
VAR Years = DATEDIFF ( Birth, Today, YEAR )
RETURN
    IF (
        DATE ( YEAR ( Today ), MONTH ( Birth ), DAY ( Birth ) ) > Today,
        Years - 1,
        Years
    )
For tenure in years and months, combine the two intervals: DATEDIFF(Hire, TODAY(), MONTH) gives total months; divide by 12 with QUOTIENT for years and use MOD for the remaining months.
Example 7: Hours and minutes between two date/time values
For timestamps, such as a ticket’s created and closed time, use HOUR or MINUTE:
Resolution Minutes = DATEDIFF(Tickets[Created], Tickets[Closed], MINUTE)To show the result as hours and minutes, format it with FORMAT(INT([Resolution Minutes] / 60), "0") & "h " & FORMAT(MOD([Resolution Minutes], 60), "00") & "m". For other display options, see Power BI date format examples.
Example 8: Date difference in Power Query
If you’d rather calculate it while loading the data, use Power Query. In Transform data, select Add Column > Custom Column and enter:
Duration.Days([Ship Date] - [Order Date])Set the new column’s type to Whole Number. If you’re unsure when to use Power Query or DAX, read Power Query vs Power BI. A Power Query column is calculated at refresh and stored like imported data, which keeps the model simple. Use DAX instead when the result must react to filters or to TODAY() at view time.
Use the date difference in a report
Once you have Days to Ship, you can group orders into buckets (0-2, 3-5, 6+ days), flag late orders with conditional formatting, or let users pick the period with a date range slicer in Power BI. All of this works best with a proper date table; here’s how to create a date table in Power BI.
Common DATEDIFF problems and fixes
- Huge negative numbers like -46,000: you subtracted dates and one is blank. Use DATEDIFF, or check with ISBLANK first.
- Negative results: the start date is later than the end date. Swap the arguments, or wrap the result in ABS if direction doesn’t matter.
- YEAR or MONTH is off by one: DATEDIFF counts boundaries, not full periods. Use the age pattern in Example 6.
- “A single value for column … cannot be determined”: you used columns directly in a measure. Wrap DATEDIFF in an iterator such as AVERAGEX or SUMX.
- The dates are text: DATEDIFF needs Date or Date/Time columns. Change the data type in Power Query, or see working with dates in a Power BI measure.
These Power BI date tutorials are useful next:
Frequently Asked Questions
How do I calculate the number of days between two dates in Power BI?
Create a calculated column with DATEDIFF(Table[Start Date], Table[End Date], DAY). The function and its intervals are described in Microsoft’s DATEDIFF reference.
Why does DATEDIFF return a negative number?
DATEDIFF returns a negative value when the first date is later than the second. Swap the two dates or use ABS.
How do I calculate days from today in Power BI?
Use TODAY() as one of the dates, for example DATEDIFF(Orders[Order Date], TODAY(), DAY). In a calculated column, TODAY() updates when the dataset refreshes.
How do I exclude weekends from a date difference?
Use NETWORKDAYS(start, end) instead of DATEDIFF. It skips Saturdays and Sundays by default and can also exclude a table of holidays.
Can I use DATEDIFF in a measure?
Yes, inside an iterator such as AVERAGEX or SUMX, for example AVERAGEX(Orders, DATEDIFF(Orders[Order Date], Orders[Ship Date], DAY)).

I have worked with Microsoft technologies for more than 18 years, including SharePoint, Microsoft 365 and the Power Platform (Power Apps, Power Automate and Power BI), at companies like HP, TCS and KPIT. I started EnjoySharePoint in 2011 to share the solutions I build in real projects with readers in the United States, Canada, the United Kingdom, Australia, New Zealand and beyond. Microsoft has recognized this work with the Microsoft MVP award 13 times since 2014.
For the power query editor calculation, what if there’s no ship date, could you today as a replacement for null?
Who can i calculate cumulative many rows to one day
Thanks for the topics. I seem to have Token Literal error on this formula:
diff row = [MRR]-LOOKUPVALUE(Data[MRR],Data[Account Name],[Account Name],Data[Report Date],CALCULATE(Max(Data[Report Date]),FILTER(Data,Data[Account Name]=EARLIER(Data[Account Name])&&Data[Report Date]<EARLIER(Data[Report Date])&&Data[MRR]BLANK())))
namely on the last part: ‘&&Data[Report Date]’
Any idea of how I could get past that? I literally copy/pasted the formula and replaced contents with my variables.
thanks
Hello I was wondering if you could help me with some code in DAX to return the difference between two dates as follows: 3 days, 2 Moths and 1 Year I have StartDate (which is Application date) and EndDate (which is DataExtract Date)
Just an FYI, I don’t think any of the values in the ‘date difference in months’ screenshot are actually correct… for example, it says the difference between ’28 Jun 2014′ and ’02 Jul 2014′ is 5 months (or 20 days) despite being only 4 days apart.
Useful article though, thanks.
Great article. The last example was excactly what I was looking for.
days difference between two date show wrong value in
Power bi date difference between two columns
as example 4 jan 2014 to 8 jan 2014 days difference show 12 (it should 4 )