
Megan Bowen dropped Order Date onto a line chart to see Contoso’s monthly revenue, and Power BI drew one sloping line between two dots: 2025 and 2026. She asked me whether the chart was broken. It wasn’t. Power BI had turned her date into a hierarchy and started at the top level.
In this tutorial, I’ll show you how the Power BI line chart date hierarchy works: where it comes from, how to drill down and expand to months, how to drop levels you don’t need, and how to choose between a continuous and a categorical X-axis. I’m using a Contoso sales table with orders from 01/01/2025 to 12/31/2026.
Quick answer: Put a date field in the line chart’s X-axis well and Power BI adds a Year, Quarter, Month, Day hierarchy, starting at Year. Select Expand all down one level in the hierarchy above the chart to go to Year and Quarter, or remove Quarter and Day with the X in the well first to jump straight to months.
Where the date hierarchy comes from
The hierarchy is created by the Auto date/time option. For every date column in an imported table, Power BI builds a hidden date table with Year, Quarter, Month and Day, and shows it as a hierarchy under the column. My guide to the Power BI date hierarchy covers it outside of charts.
You’ll find the setting under File > Options and settings > Options > Current File > Data Load > Time intelligence > Auto date/time. The Global page has Auto date/time for new files. Turning it off for the current file removes the hidden tables and breaks visuals that use the hierarchy.
Add a date hierarchy to a line chart
- Select Line chart in the Visualizations pane.
- Check Order Date in the Data pane. It goes to X-axis with Year, Quarter, Month and Day under it.
- Check Revenue. It goes to Y-axis as Sum of Revenue.
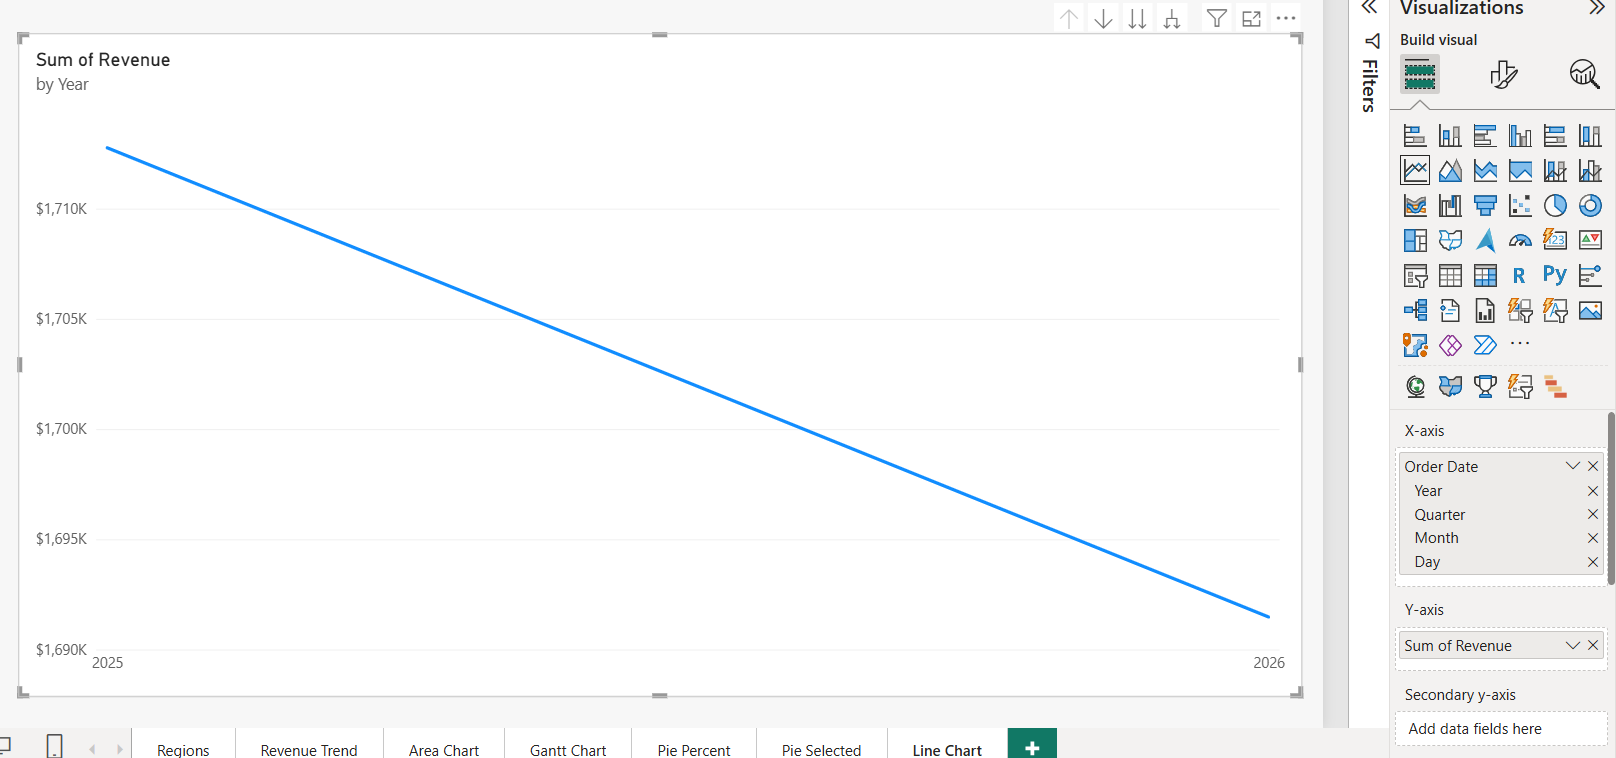
The chart shows the Year level only, so two years means two points. The drill icons above the visual let you move down. If you haven’t built a line chart before, my Power BI line chart guide covers the basics.
The four drill icons
Hover over the line chart to see the drill icons in its header. They work the same way on bar, column and pie charts; I show the pie version in Power BI pie chart drill down.
| Icon | Name | What it does |
|---|---|---|
| Up arrow | Drill up | Goes back one level. Dimmed until you drill down. |
| Down arrow | Click to turn on drill down | Turns on drill mode; then select a point, such as 2026, to see only its quarters. |
| Double down arrow | Go to the next level in the hierarchy | Replaces the level for every point: years become quarters, without the year. |
| Forked arrow | Expand all down one level in the hierarchy | Adds the next level and keeps the parent: 2025 Qtr 1, 2025 Qtr 2 and so on. |
Right-click a point for the same options: Drill down, Drill up, Show next level and Expand to next level. For trends across years, Expand all down is usually what you want, because Go to the next level merges January 2025 and January 2026 into one January point.
Expand to Year and Month (and drop Quarter)
Most monthly reports don’t need quarters. Expanding from Year takes you to Year and Quarter, and a second click to Month. Removing the levels you don’t need is quicker:
- In the X-axis well, select the X next to Day, then the X next to Quarter. Year and Month remain.
- Select Expand all down one level in the hierarchy above the chart.
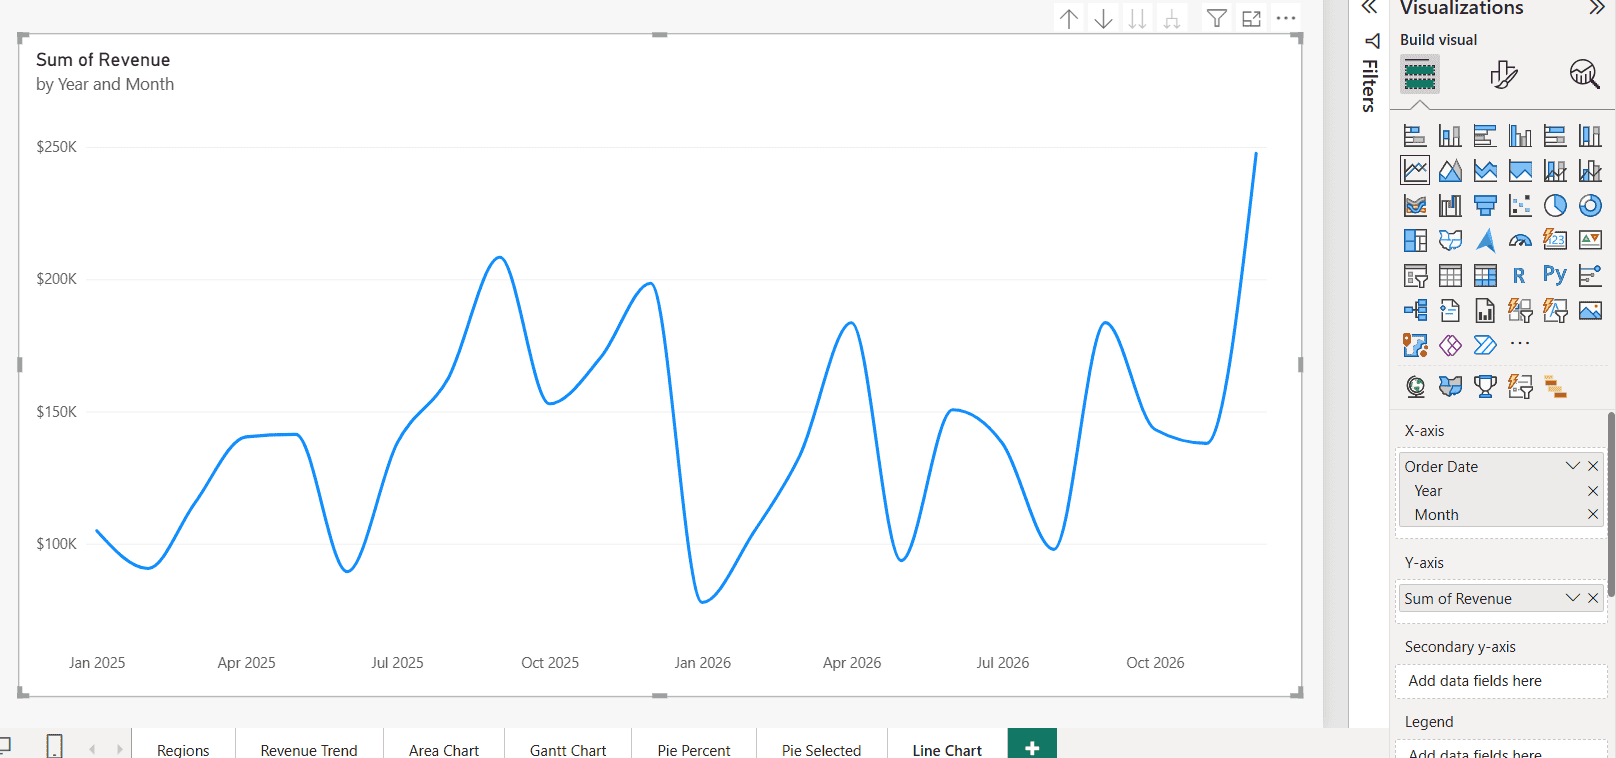
The subtitle changes to "by Year and Month", and the chart shows 24 points. You can put the levels back later by dragging Order Date into the well again. To build your own hierarchy instead, see how to create a hierarchy in Power BI.
Continuous vs. categorical X-axis
Look at the axis labels in the last screenshot: Jan 2025, Apr 2025, Jul 2025. Where did February and March go? Nowhere. They’re plotted; the Continuous axis just thins its labels to keep them readable. The first version of this post got this wrong and called the fix a continuous axis.
Here’s how the two types behave. You change it in Format visual > X-axis > Type:
| Continuous | Categorical | |
|---|---|---|
| Spacing | Proportional to time | One slot per point |
| Labels | Thinned automatically | One per point, with a scroll bar if needed |
| Missing months | The line connects across them | Gaps can show with Show items with no data |
| Trend line and forecast | Available | Not available |
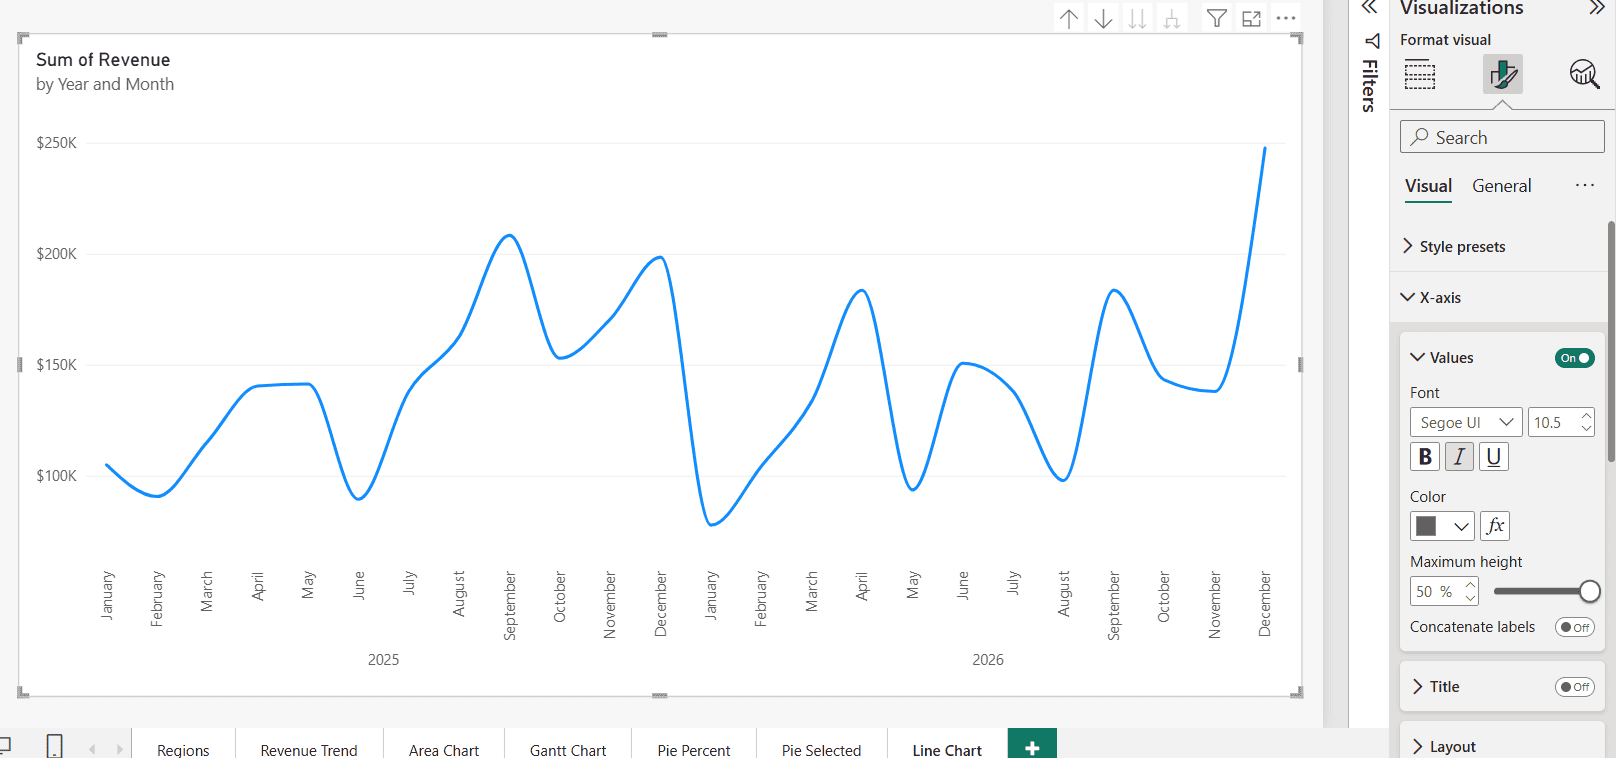
Switch Type to Categorical when every month needs its own label. With the hierarchy expanded, Power BI writes the months in one row and the years in a second row underneath:
Concatenate labels
The Concatenate labels toggle sits under X-axis > Values once the axis is categorical. In my chart it was Off, which gives the two-row layout above. Turn it On to combine the levels into one label per point, such as 2025 January.
Two rows save horizontal space and make year boundaries obvious. Concatenated labels are easier to read when the chart is small or the labels rotate.
Use the plain date field instead of the hierarchy
Sometimes you don’t want a hierarchy at all, for example for daily data or a forecast. In the X-axis well, select the arrow next to Order Date and choose Order Date instead of Date Hierarchy. The axis then shows one continuous date scale.
This is also the fastest fix when the axis looks wrong after someone drilled down and saved. If you need to limit the dates shown, see how to filter dates in Power BI.
Using your own date table
Many models turn off Auto date/time and use a dedicated date table instead. That’s a good practice; see how to create a date table in Power BI. Build a Year, Month hierarchy on it and use that on the axis.
Avoid a text column like this one on the axis if you want a continuous scale:
Year Month = FORMAT ( 'Date'[Date], "YYYY-MM" )Text is always categorical. It sorts correctly in YYYY-MM form, but you lose trend lines and forecasts. SQLBI showed in October 2026 that a continuous axis is still possible with your own date table, but only when the hierarchy ends in a real date column.
Troubleshooting
- The chart shows only years: you’re at the Year level. Expand all down, or switch to the plain date field.
- January 2025 and January 2026 are merged: you used Go to the next level instead of Expand all down one level.
- No hierarchy appears under my date: Auto date/time is off, the column is text instead of Date, or it’s on the many side of a relationship.
- Months appear in alphabetical order: you used a text month column. Sort it by a month-number column or use the hierarchy.
- The line drops to zero or breaks: a month has no data. See how to show zero values in a line chart.
Working on more time-based visuals? These tutorials go well with this one:
Frequently Asked Questions
How do I show a date hierarchy in a Power BI line chart?
Add a date column to the X-axis well. With Auto date/time on, Power BI creates a Year, Quarter, Month and Day hierarchy and starts at Year.
How do I show months instead of years on the X-axis?
Remove Quarter and Day from the X-axis well, then select Expand all down one level in the hierarchy above the chart.
Why is my Power BI line chart X-axis missing months?
On a continuous axis, Power BI thins the labels. The months are still plotted. Switch X-axis Type to Categorical to label every month.
What does Concatenate labels do in Power BI?
With a categorical axis and an expanded hierarchy, it combines the levels into one label, such as 2025 January. Off shows them in separate rows.
How do I turn off the automatic date hierarchy?
Clear Auto date/time under File > Options and settings > Options > Current File > Data Load. The Microsoft Learn auto date/time article explains what changes.

I have worked with Microsoft technologies for more than 18 years, including SharePoint, Microsoft 365 and the Power Platform (Power Apps, Power Automate and Power BI), at companies like HP, TCS and KPIT. I started EnjoySharePoint in 2011 to share the solutions I build in real projects with readers in the United States, Canada, the United Kingdom, Australia, New Zealand and beyond. Microsoft has recognized this work with the Microsoft MVP award 13 times since 2014.