
A sales manager at Contoso asked me for one chart that starts with revenue by region and lets her click down to each state and city. Building three separate charts would have cluttered the page. The answer was to create a hierarchy in Power BI, so one visual can move from Region to State to City with a click.
In this tutorial, I’ll show you how to build that hierarchy in Power BI Desktop, change its levels, use it to drill down in a chart, and handle the date hierarchy that Power BI adds for you. I’m using a Contoso sales table with 900 orders from 2025 and 2026.
Quick answer: In Power BI Desktop, right-click the top-level field in the Data pane (for example Region) and select Create hierarchy. Then right-click each lower field, select Add to hierarchy, and pick the new hierarchy. Drop the hierarchy into a visual’s axis or rows and use the drill icons to move between levels.
What a hierarchy is in Power BI
A hierarchy is a set of columns from one table arranged from general to detailed, like Region > State > City or Category > Product. When you add it to a visual, Power BI shows the top level first and adds drill buttons so readers can move down and back up.
Hierarchies are handy in column charts, bar charts, matrices and slicers. In a matrix, each level becomes a row group you can expand with the plus and minus icons, which is also how you show matrix rows without a hierarchy when you don’t want the nesting.
My example uses one Sales table with these columns: Order ID, Order Date, Region, State, City, Category, Product, Sales Rep, Units, Revenue and Profit.
How to create a hierarchy in Power BI Desktop
Start with the least detailed field. In my case that’s Region, because each region contains several states.
- Open your report in Power BI Desktop and expand the table in the Data pane.
- Right-click Region (or select the More options dots next to it) and select Create hierarchy.
- Power BI adds a new field called Region Hierarchy with Region as its first level.
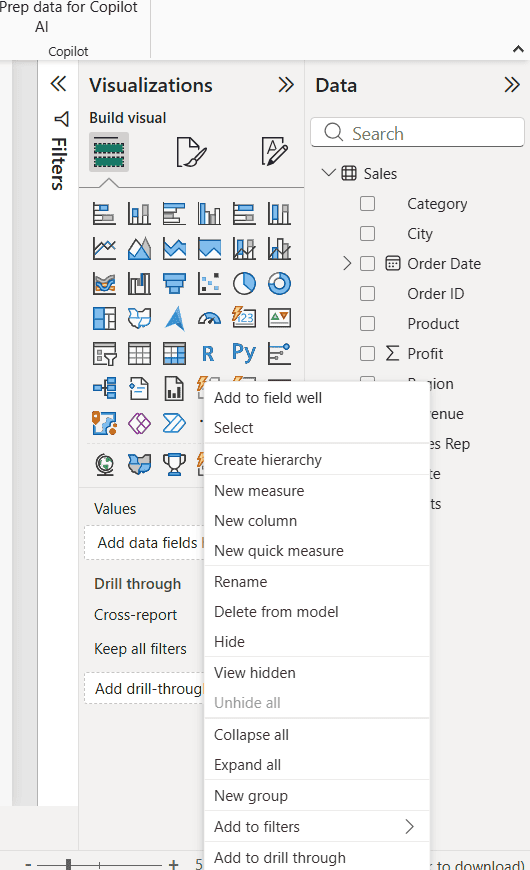
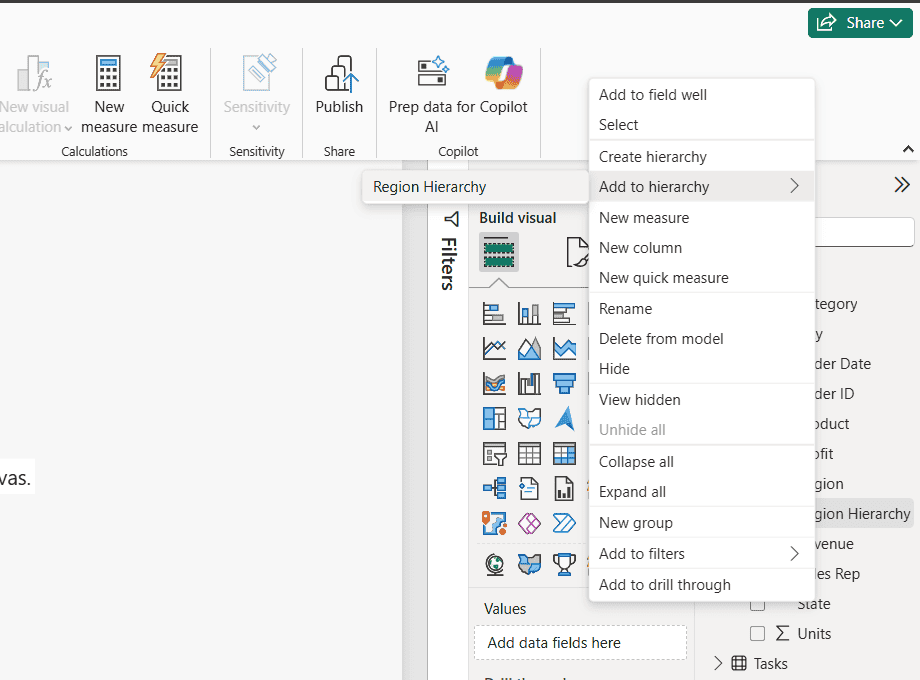
Next, add the lower levels in order. Right-click State, point to Add to hierarchy, and select Region Hierarchy. Do the same for City.
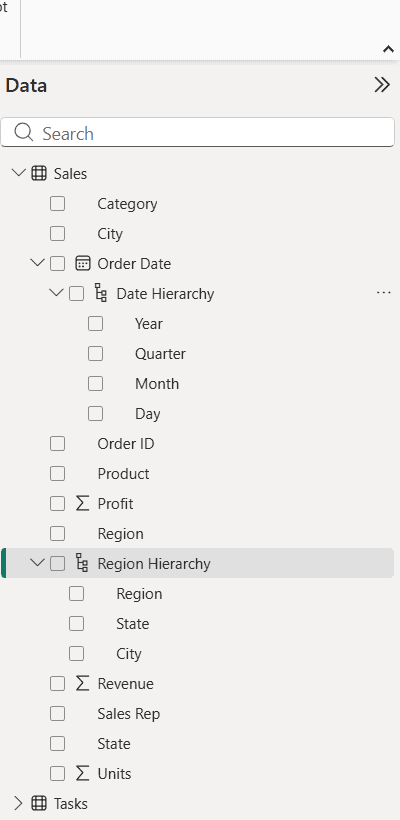
Expand Region Hierarchy in the Data pane, and you’ll see Region, State and City in that order. The original columns stay in the table, so you can still use them on their own.
You can also drag one field onto another field in the Data pane to start a hierarchy. If your data comes from SharePoint, first build a Power BI report from a SharePoint list and then add the hierarchy the same way.
Rename, reorder and remove hierarchy levels
Power BI names the hierarchy after its first field. To change that, or to fix the order of the levels, use the Properties pane:
- Select the Model view icon on the left side of Power BI Desktop.
- In the Data pane, select the hierarchy. The Properties pane opens.
- Change the Name, for example to Geography.
- Under Levels, drag a level up or down to reorder it, rename a level, or select the X next to a level to remove it.
- Select Apply Level Changes. Nothing changes until you do.
You can also rename the hierarchy or a level directly in the Data pane with right-click > Rename. To remove the whole hierarchy, right-click it and select Delete from model. The columns it used aren’t deleted.
One rule to remember: every level must come from the same table. If State lives in a separate Geography table, build the hierarchy in that table, not in Sales. Measures can’t be hierarchy levels either.
Use the hierarchy in a visual and drill down
Select a clustered column chart on the canvas, then check Region Hierarchy and Revenue in the Data pane. The whole hierarchy lands in the X-axis well, and the chart shows Sum of Revenue by Region.
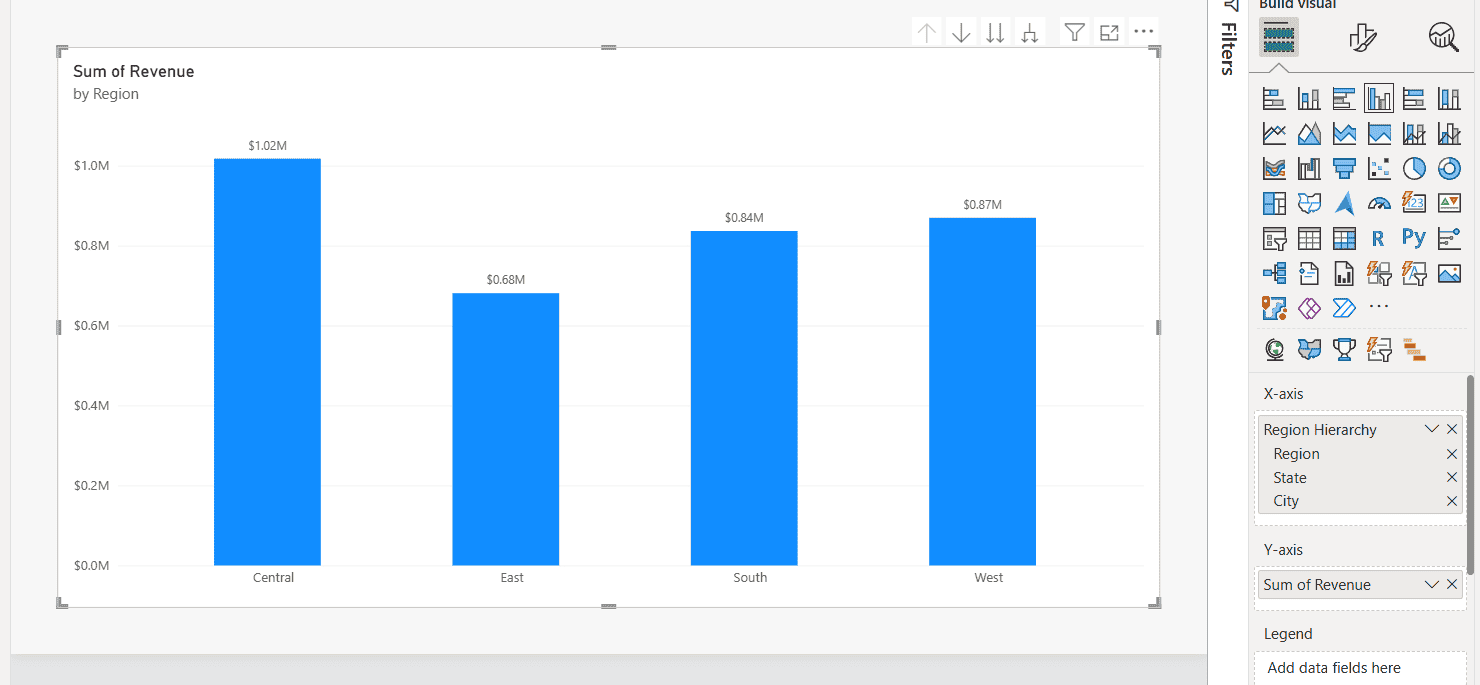
Hover over the chart to see the drill icons above it. Here’s what each one does:
| Icon | What it does |
|---|---|
| Drill up (up arrow) | Goes back one level. |
| Click to turn on drill down (single down arrow) | Turns on drill mode. Clicking a column then shows only its children, such as the states in Central. |
| Go to the next level in the hierarchy (double arrow) | Shows the next level for all values, for example every state. |
| Expand all down one level in the hierarchy (forked arrow) | Shows the next level and keeps the parent in the label, like Central Illinois. |
I turned on drill mode and clicked the Central column. The chart now shows Colorado, Illinois and Texas, and the title changes to by Region and State.
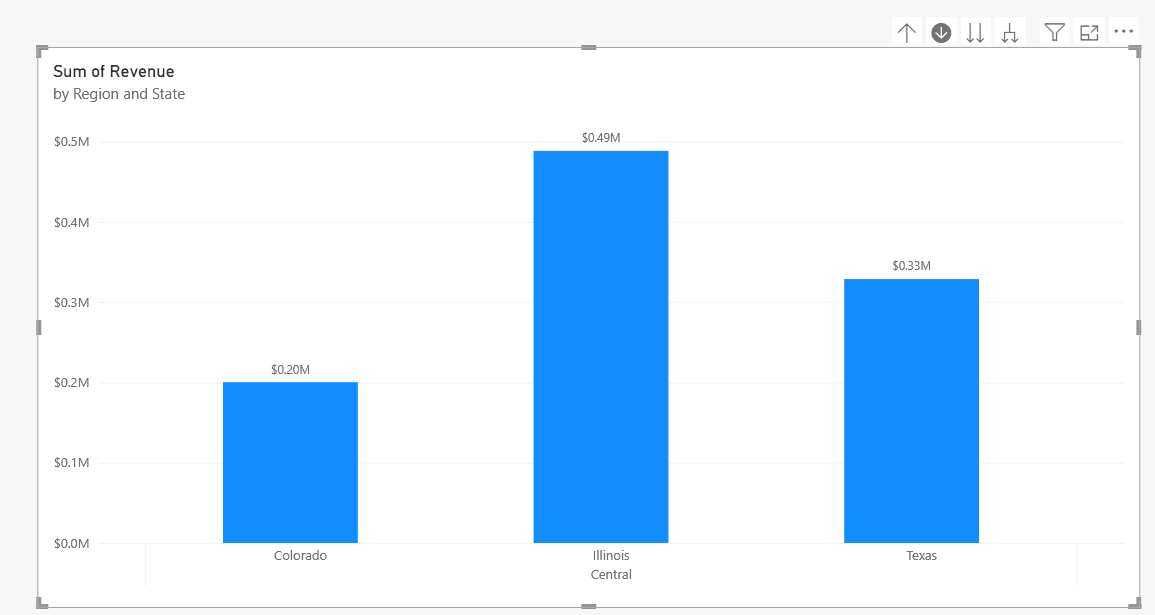
You can also right-click a column and use Drill down, Drill up, Show next level or Expand to next level. Drilling doesn’t filter other visuals by default; that’s controlled when you edit visual interactions in Power BI.
Pie charts work the same way. See how to drill down in a Power BI pie chart for that version.
The automatic date hierarchy (Auto date/time)
In the Data pane screenshot, Order Date has its own Date Hierarchy with Year, Quarter, Month and Day. I didn’t build it. Power BI’s Auto date/time option creates a hidden date table and this hierarchy for every date column in an Import table.
It’s useful for quick reports, but it adds a hidden table per date column and can’t be customized.
To turn it off, go to File > Options and settings > Options, then Data Load under Current File (or Global for new files), and clear Auto date/time in the Time intelligence section. Then create a date table in Power BI and build your own Year > Quarter > Month hierarchy there.
When you drop a date column into a visual, you can switch between the column and its Date Hierarchy from the field’s drop-down in the well. The Power BI date hierarchy tutorial covers that in more detail.
Use a hierarchy in a slicer
Drag a hierarchy (or several fields) into a slicer’s Field well, and the slicer shows expandable levels, so readers can pick a region or a single city. This works in the standard slicer and the list slicer. The button slicer doesn’t support hierarchies. For the other slicer options, see the guide to Power BI slicer types.
Parent-child hierarchies with PATH
Some data stores the hierarchy in rows instead of columns, like an Employees table where each person has a ManagerID. A normal hierarchy can’t read that. Flatten it first with the DAX PATH and PATHITEM functions in calculated columns:
Manager Path = PATH ( Employees[EmployeeID], Employees[ManagerID] )

Level 1 = LOOKUPVALUE ( Employees[Name], Employees[EmployeeID],
    PATHITEM ( Employees[Manager Path], 1, INTEGER ) )

Level 2 = LOOKUPVALUE ( Employees[Name], Employees[EmployeeID],
    PATHITEM ( Employees[Manager Path], 2, INTEGER ) )
Add a Level column for each depth you need (Level 3, Level 4 and so on), then create a hierarchy from Level 1, Level 2 and Level 3 like any other. Blank levels show as (Blank) in visuals, so hide them with a filter if your tree is uneven.
Common hierarchy problems and fixes
- Add to hierarchy is missing: the field is in a different table from the hierarchy. Move the column, or build the hierarchy in the other table.
- Drill icons don’t appear: the visual has only one level in its axis. Add the whole hierarchy, not a single level.
- Levels are in the wrong order: reorder them in the Model view Properties pane and select Apply Level Changes.
- No Date Hierarchy under a date column: Auto date/time is off, the table uses DirectQuery, or the column isn’t a Date type. Set the type in Column tools > Data type.
- Months sort alphabetically: use the hierarchy’s Month level or sort your month name column by a month number column.
If you’re building drill-down reports, these walkthroughs help next:
Frequently Asked Questions
How do I create a hierarchy in Power BI?
Right-click the top field in the Data pane and select Create hierarchy. Then right-click each lower field, select Add to hierarchy, and choose the new hierarchy. Put the hierarchy in a visual to drill down.
Can a Power BI hierarchy use columns from different tables?
No. All levels must come from the same table, as the Microsoft Learn guide to creating hierarchies shows. Move or merge the columns into one table first.
How do I change the order of hierarchy levels?
Open Model view, select the hierarchy, drag the levels into the right order in the Properties pane, and select Apply Level Changes.
How do I remove the automatic date hierarchy?
Go to File > Options and settings > Options > Data Load (Current File) and clear Auto date/time under Time intelligence. Use your own date table instead.
Why can’t I drill down in my Power BI chart?
The axis needs two or more levels. Add the full hierarchy, then select Click to turn on drill down or use Go to the next level in the hierarchy.

Preeti Sahu is a Microsoft MVP for Power Apps with over six years of experience working with SharePoint Online and the Power Platform. She is the co-author of the book Microsoft Power Platform: A Deep Dive. As a Power Platform developer, she has built various tools with Power Apps and Power Automate, and she makes Microsoft 365 videos for YouTube.