
You have a sales tracker in your app, but the records are just one long list. When your manager asks for total sales by region, open deals by rep, or order counts by status, scrolling through raw rows does not help.
That is exactly where the Power Apps GroupBy Function helps. It lets you group related records into buckets, so you can summarize data, build cleaner galleries, and show useful totals from the same source table.
Power Apps GroupBy Function
In this article, I’ll show you 4 ways to use the Power Apps GroupBy Function.
Method 1 – Group Records by One Column in Power Apps
Use this method when you want a simple grouped list, such as orders by Region. It’s great for summary screens that show one row per group.
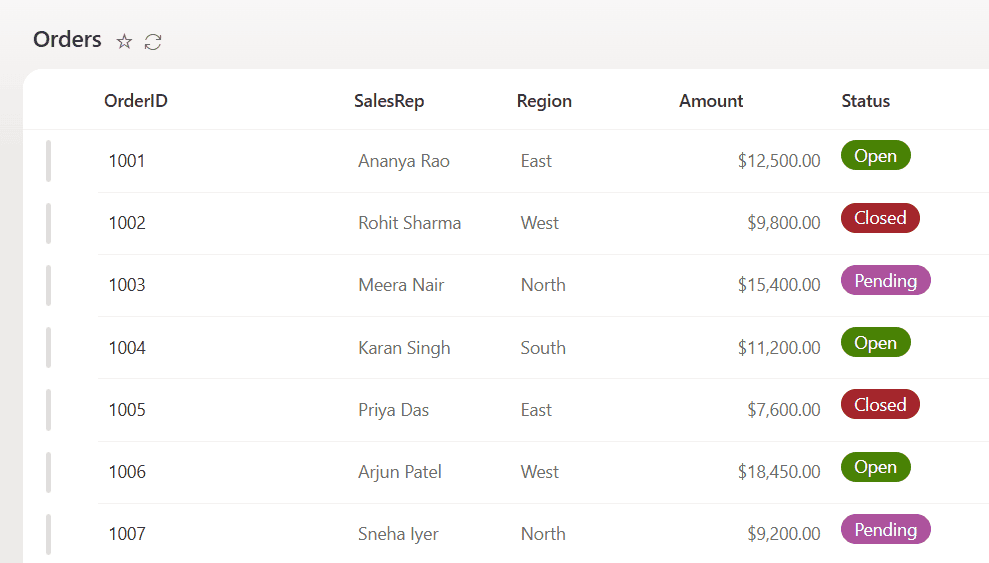
For all methods, I’ll use the same data source. Here are the SharePoint list Orders column details.
| Column Name | Data Type |
|---|---|
| OrderID | Title |
| SalesRep | Single line of Text |
| Region | Single line of Text |
| Amount | Number (Currency/Decimal) |
| Status | Choice(Open, Closed, Pending) |
Step 1: Add a gallery for regions in Power Apps
Go to Power Apps App→ Insert → Gallery → Vertical and add a modern vertical gallery to the screen. Rename it to galRegions so your formulas stay readable.
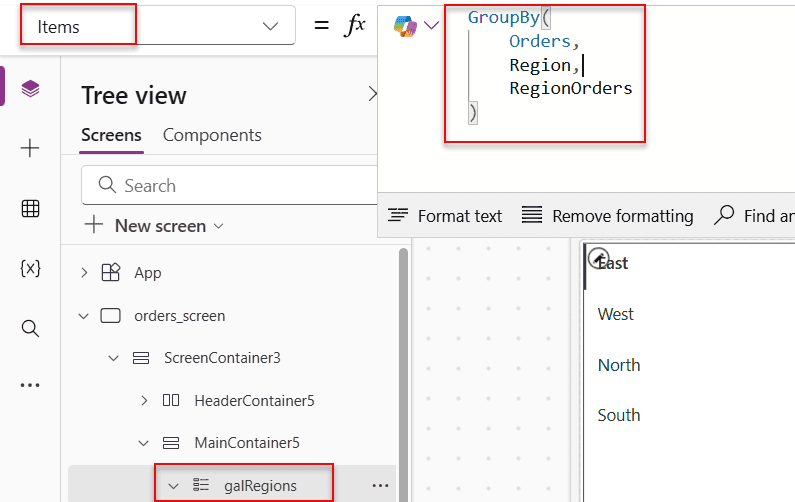
Step 2: Set Items with Power Apps GroupBy
Set the Items property of galRegions to:
GroupBy(
    Orders,
    Region,
    RegionOrders
)
How does this formula work?
GroupBy takes the Orders table and groups records by the Region column. It returns a new table in which each record represents a region, and the matching orders for that region are stored in a nested table column named RegionOrders.
Step 3: Show the region name
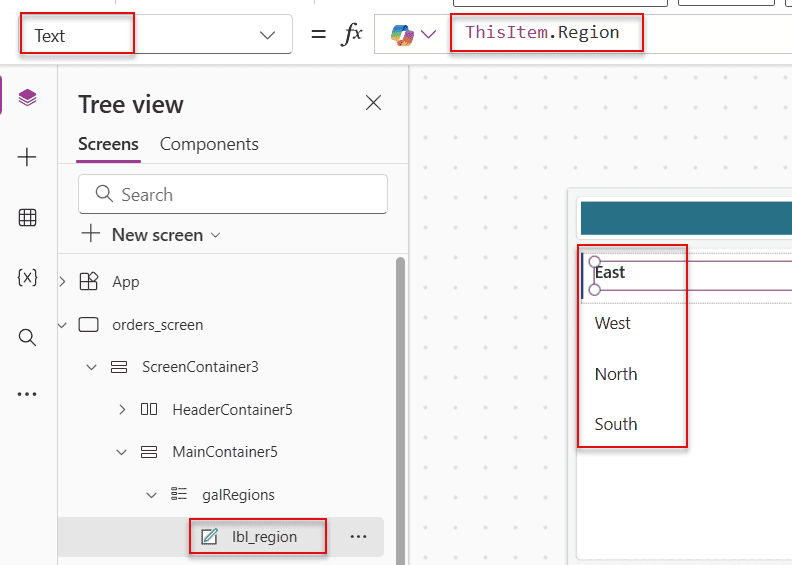
Insert a label inside galRegions and set its Text property to:
ThisItem.Region
How does this formula work?
Each grouped record returned by GroupBy still contains the Region column. ThisItem.Region simply displays that region value for the current gallery row.
Pro Tip: Use short, clear group names like Region or Status. Long text in the group column will make your grouped gallery hard to scan.
Method 2 – Group Records with a Nested Gallery in Power Apps
Use this method when you want an expandable section: a region header, followed by all the orders in that region. This pattern works well for review screens and manager dashboards.
Step 1: Keep the grouped parent Power Apps gallery
Continue using galRegions with Items set to:
GroupBy(
    Orders,
    Region,
    RegionOrders
)
How does this formula work?
The parent gallery now shows one row per region, and each record has a nested table RegionOrders that contains all matching orders for that region.
Step 2: Add the child Power Apps gallery
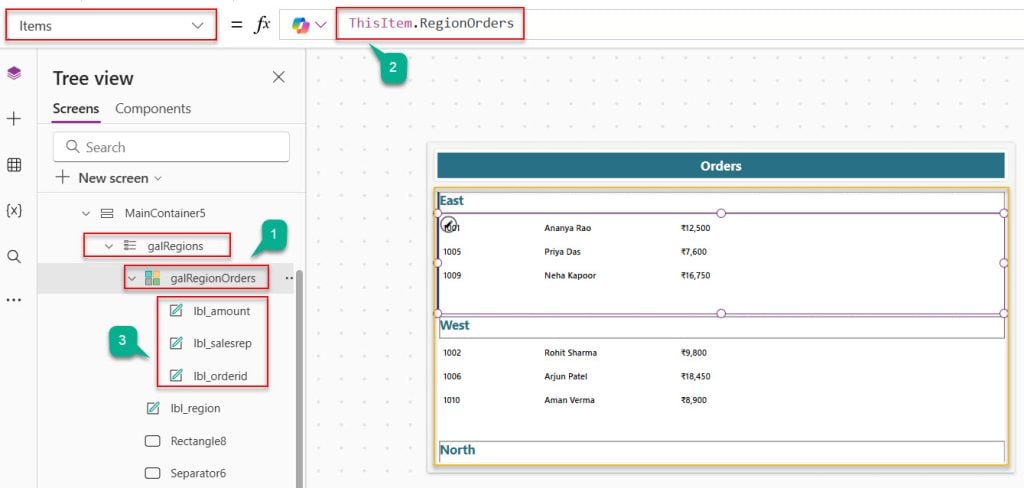
Inside galRegions, go to Power Apps App→ Insert → Gallery → Vertical and add a second modern gallery. Rename it to galRegionOrders.
Step 3: Bind the child gallery to RegionOrders
Set the Items property of galRegionOrders to:
ThisItem.RegionOrders
How does this formula work?
For each region row in the parent gallery, ThisItem.RegionOrders points to the nested table created by GroupBy. The child gallery now only shows orders that belong to the current region.
Step 4: Show order details in the child Power Apps gallery
Inside galRegionOrders, add labels for key order fields. For example:
ThisItem.OrderID
ThisItem.SalesRep
Text(ThisItem.Amount, "₹#,##0")
How does these formulas work?
Each ThisItem in the child gallery represents a single order row from RegionOrders. You can display any column from Orders, and format Amount with Text() to show a currency-friendly value.
Pro Tip: Nested galleries can get heavy with large data sets. Keep the child gallery layout minimal and avoid unnecessary controls to keep scrolling smooth.
Method 3 – Group and Aggregate with AddColumns in Power Apps
Use this method when you want summary numbers, such as total sales amount and order count per region. You’ll combine GroupBy with AddColumns, Sum, and CountRows.
Step 1: Build a grouped summary table in Power Apps
Create a summary source for your gallery by setting galRegions.Items to:
AddColumns(
    GroupBy(
        Orders,
        Region,
        RegionOrders
    ),
    TotalAmount,
    Sum(RegionOrders, Amount),
    OrderCount,
    CountRows(RegionOrders)
)
How does this formula work?
First, GroupBy creates one row per region and stores matching orders in RegionOrders. Then AddColumns adds two new columns to that grouped table: TotalAmount, which uses Sum() to add Amount across RegionOrders, and OrderCount, which uses CountRows() to count all orders in that group.
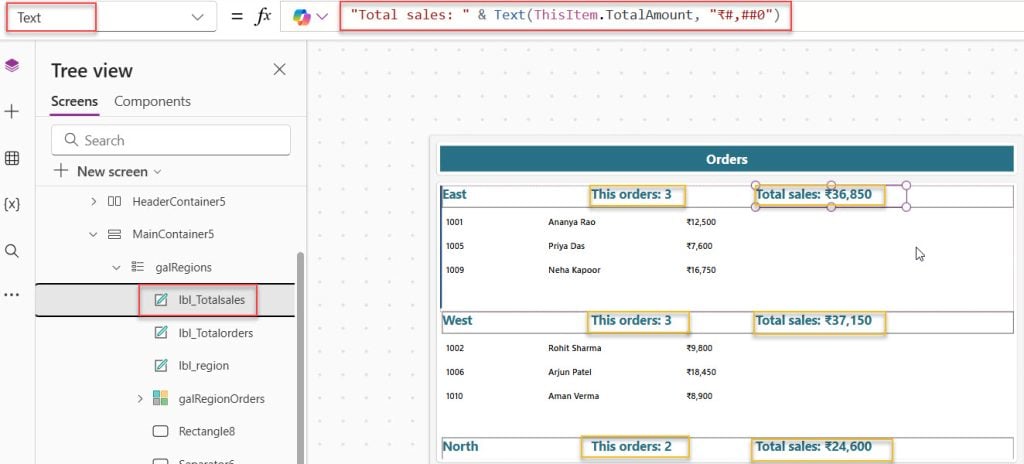
Step 2: Show region, count, and total in the Power Apps gallery
Add three labels inside galRegions and set their Text properties like this:
ThisItem.Region
"This orders: " & ThisItem.OrderCount
"Total sales: " & Text(ThisItem.TotalAmount, "₹#,##0")
How does these formulas work?
You display the Region directly, then build readable strings using OrderCount and TotalAmount, with Text() formatting the total amount in a currency-friendly way. Using text strings keeps the UI clear for business users.
Pro Tip: Use AddColumns on collections or smaller datasets when possible. On very large SharePoint lists or Dataverse tables, complex aggregations in a single formula can slow your app.
Method 4 – Group, Filter, and Sort for a Focused View in Power Apps
Use this method when you want grouped summaries but only for specific records, such as Status = “Open” or a selected Region. You’ll wrap GroupBy around a filtered source.
Step 1: Filter the source before grouping in Power Apps
Set galRegions.Items to:
AddColumns(
    GroupBy(
        Filter(
            Orders,
            Status = "Open"
        ),
        Region,
        RegionOrders
    ),
    TotalAmount,
    Sum(RegionOrders, Amount),
    OrderCount,
    CountRows(RegionOrders)
)
How does this formula work?
Filter() first selects only orders where Status is “Open”. Then GroupBy groups those open orders by Region into the nested RegionOrders table. Finally, AddColumns adds TotalAmount and OrderCount based on just the filtered orders.
Step 2: Sort the grouped result in Power Apps
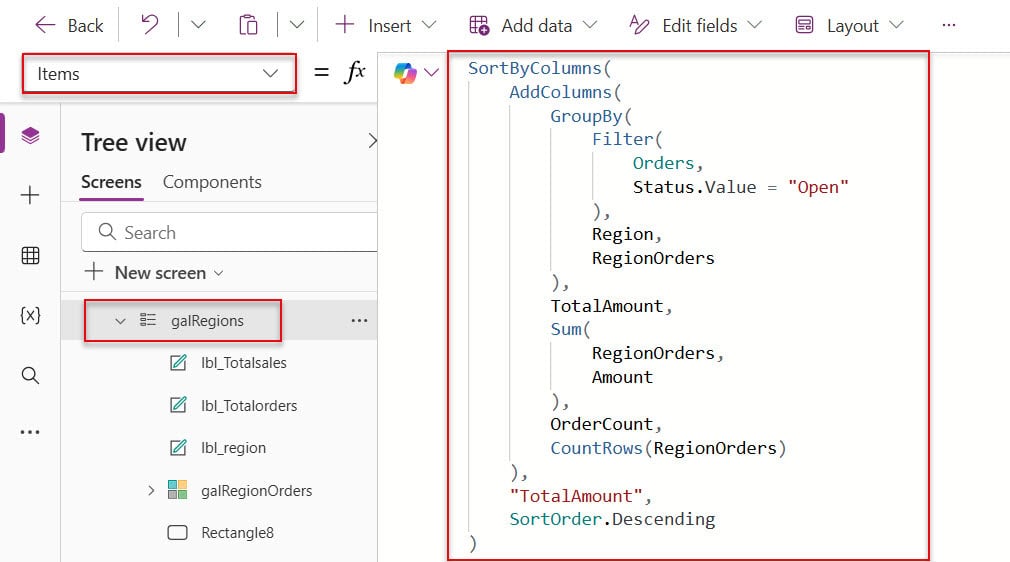
To sort regions by descending total sales, change the Items formula to:
SortByColumns(
    AddColumns(
        GroupBy(
            Filter(
                Orders,
                Status.Value = "Open"
            ),
            Region,
            RegionOrders
        ),
        TotalAmount,
        Sum(
            RegionOrders,
            Amount
        ),
        OrderCount,
        CountRows(RegionOrders)
    ),
    "TotalAmount",
    SortOrder.Descending
)
How does this formula work?
You build the same grouped summary table, then pass it into SortByColumns() and sort by TotalAmount in SortOrder.Descending order. That makes the highest-revenue regions appear at the top of the gallery.
Step 3: Display focused grouped data in Power Apps
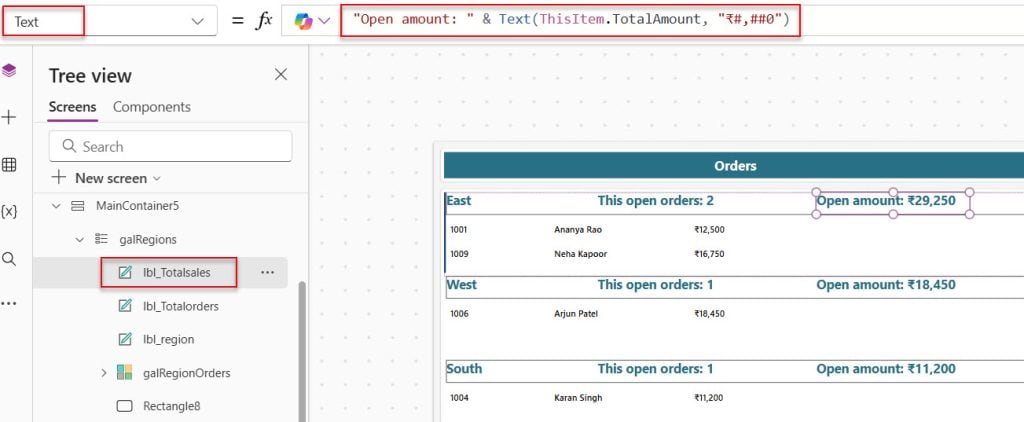
Use labels in galRegions to show the region name, number of open orders, and total open amount:
ThisItem.Region
"This open orders: " & ThisItem.OrderCount
"Open amount: " & Text(ThisItem.TotalAmount, "₹#,##0")
How does these formulas work?
You’re reusing the summary columns OrderCount and TotalAmount, but now they represent only open orders. This way, managers see focused metrics rather than totals across all statuses.
Pro Tip: Keep your filter conditions simple and delegable when working with large data sources. Complex expressions in Filter() can stop delegation and limit how many records Power Apps actually retrieves.
Things to Keep in Mind for Power Apps GroupBy Function
- GroupBy delegation behavior. Grouping itself is often non-delegable for SharePoint and some other connectors, so prefer grouping on collections or smaller datasets when your tables are large.
- Filter before GroupBy on big lists. Filter() is delegable on many modern data sources; applying it before GroupBy reduces rows and keeps your app faster.
- Use global vs context variables carefully. Set() creates global variables that live across screens, while UpdateContext() creates local variables. Store grouped tables in global variables only when you reuse them in many places.
- Named formulas for reusable logic. In modern Power Apps, named formulas are great for read-only expressions like grouped summary tables you don’t plan to modify, while variables are better for values that change over time.
- Watch performance with nested galleries. Nested modern galleries are powerful but can impact performance on mobile devices. Keep templates light and avoid unnecessary controls inside child galleries.
- Canvas vs model-driven behavior. GroupBy is a Power Fx function you use in canvas apps. Model-driven apps rely on views and server-side aggregation instead, so don’t expect GroupBy formulas to work there.
Conclusion
I hope you found this article helpful. You’ve seen four practical ways to use the Power Apps GroupBy Function: simple grouping, nested galleries, grouped summaries with totals, and filtered, sorted metrics. Use basic grouping for quick headers, nested galleries for drill-down, and the AddColumns-based methods for summary numbers and filtered metrics.
Also, you may like:
- Power Apps Named Formulas
- Display Date Without Time in Power Apps
- Filter SharePoint List Items in Power Apps
- Filter Gallery By Radio Button in Power Apps

I have worked with Microsoft technologies for more than 18 years, including SharePoint, Microsoft 365 and the Power Platform (Power Apps, Power Automate and Power BI), at companies like HP, TCS and KPIT. I started EnjoySharePoint in 2011 to share the solutions I build in real projects with readers in the United States, Canada, the United Kingdom, Australia, New Zealand and beyond. Microsoft has recognized this work with the Microsoft MVP award 13 times since 2014.