
Megan Bowen at Contoso wants a screen in her sales app that shows revenue and expenses for each month of 2026, side by side. A Power Apps column chart does exactly that, but only if the data is shaped the way the chart expects. Get that wrong and you get a blank chart with no error.
In this tutorial, I’ll build that chart from a collection, add a second series, change the colors, color single bars by a condition, and chart a SharePoint list with GroupBy. Every formula and setting here comes from the app I built for this post.
Quick answer: Select + Insert > Charts > Column chart, select the middle part of the chart, and set Items to a table whose first column holds the labels and the next columns hold numbers. Set NumberOfSeries to the number of value columns (up to 9) and use ItemColorSet for the colors.
Add a column chart to your app
In Power Apps Studio, select + Insert and open Charts, or search for chart. The group has four controls: Column chart, Line chart, Pie chart and Power BI tile. Select Column chart. It appears with sample data until you connect your own.
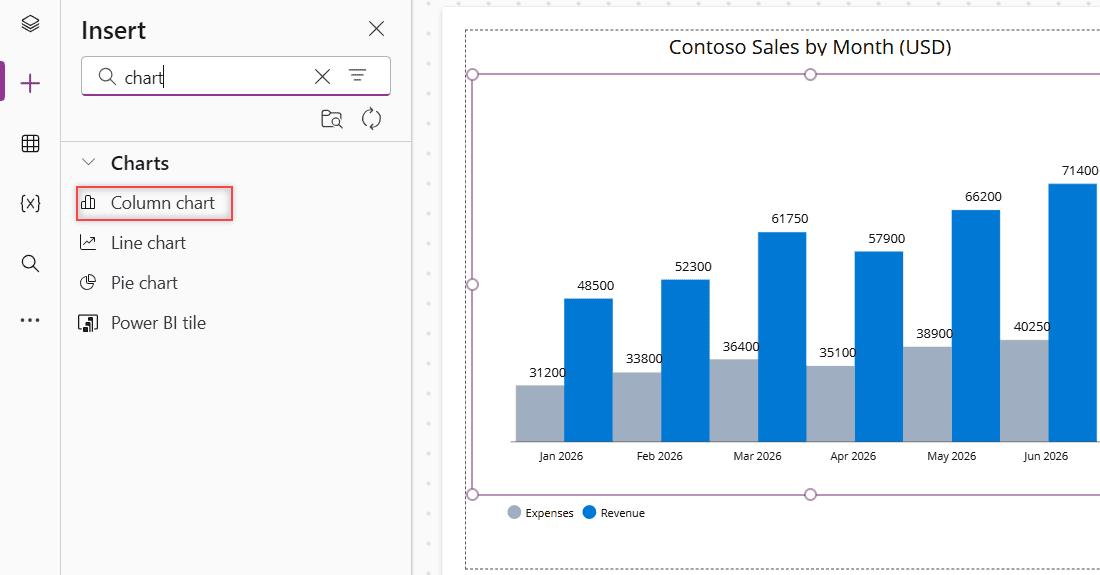
The column chart is a group of three controls. In the tree view you’ll see CompositeColumnChart1 with a title label, ColumnChart1 and Legend1. Data settings such as Items and NumberOfSeries belong to ColumnChart1, so click the middle of the chart before you change them.
For the line and pie charts in the same group, see this Power Apps chart control overview.
The legend isn’t wired up by hand: its Items property is already ColumnChart1.SeriesLabels, so it follows the chart’s series.
How the chart reads your data
Older tutorials tell you to pick the label and series columns in an Advanced tab. Current Studio doesn’t have those settings. When I searched the chart’s properties for Series, only NumberOfSeries, SeriesAxisMax and SeriesAxisMin came up. The chart reads the columns from Items instead:
- The text column becomes the labels under the columns.
- The number columns become the series. NumberOfSeries decides how many are drawn.
- Values must be numbers. Text like
"$120"or the result ofText()won’t draw a column.
One thing surprised me. In my collection, I listed Revenue before Expenses, but the chart drew Expenses first. Wrapping Items in ShowColumns with a different order didn’t change it. So always check the legend to see which series is first before you set colors.
Build a column chart with two series
For Megan’s chart, I created a collection in App.OnStart. To run it while you’re editing, select the three dots next to App in the tree view and choose Run OnStart. Here’s more on how to create a Power Apps collection in OnStart.
ClearCollect(
    colMonthlySales,
    {Month: "Jan 2026", Revenue: 48500, Expenses: 31200},
    {Month: "Feb 2026", Revenue: 52300, Expenses: 33800},
    {Month: "Mar 2026", Revenue: 61750, Expenses: 36400},
    {Month: "Apr 2026", Revenue: 57900, Expenses: 35100},
    {Month: "May 2026", Revenue: 66200, Expenses: 38900},
    {Month: "Jun 2026", Revenue: 71400, Expenses: 40250}
)
Then select ColumnChart1 and set:
- Items:
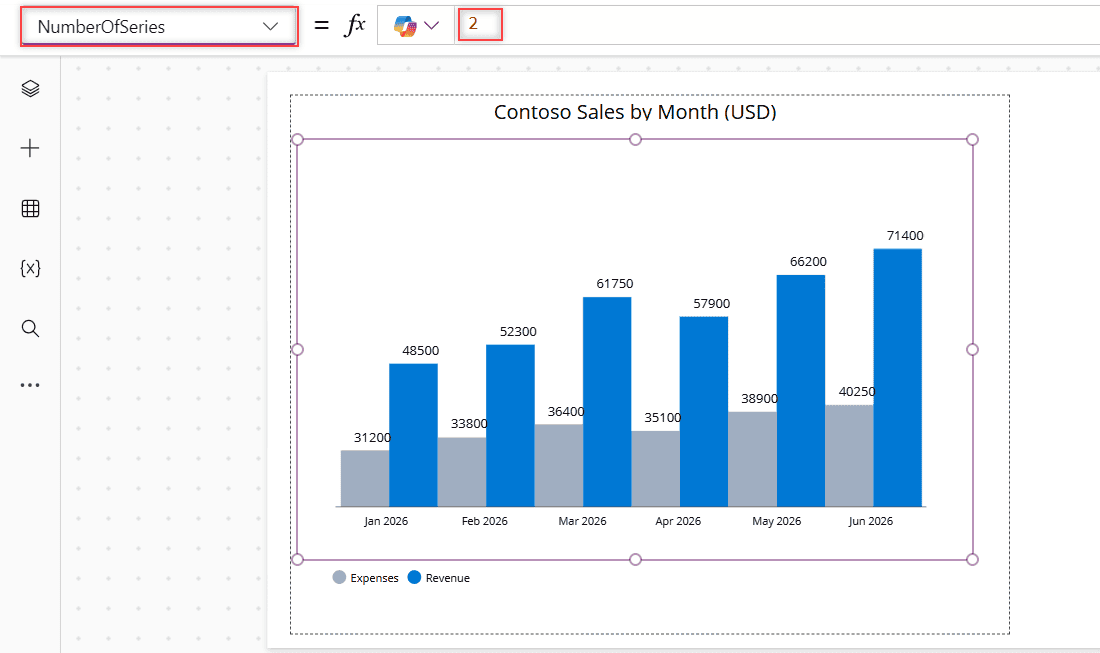
colMonthlySales - NumberOfSeries:
2 - XLabelAngle:
0, so the month names sit flat. The default is 60.
With one series, you only see one value column. With NumberOfSeries set to 2, each month gets an Expenses column and a Revenue column, and the legend shows both. Microsoft’s reference says a chart can show up to 9 series.
Change the colors with ItemColorSet
ItemColorSet takes a table of colors. In a chart with several series, each color goes to one series, in the same order as the legend. Because Expenses comes first in my chart, gray goes first:
[RGBA(160, 174, 192, 1), RGBA(0, 120, 212, 1)]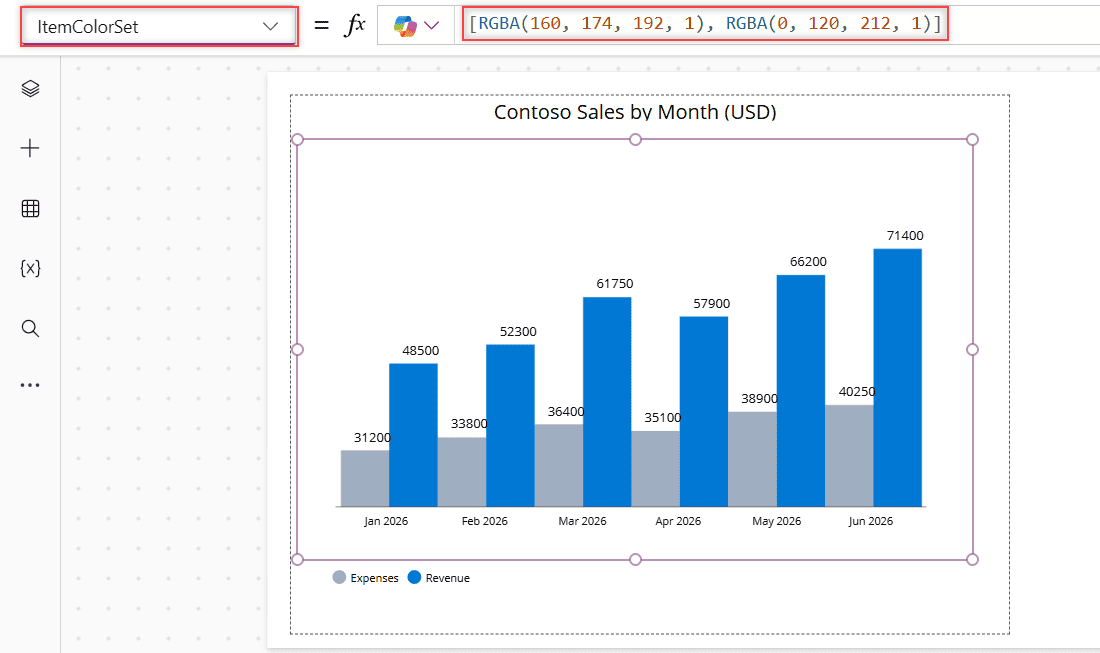
You can also use named colors like Color.SteelBlue or hex codes with ColorValue("#0078D4"). The same property works on the Power Apps line chart, where each color is one line.
Chart a SharePoint list with GroupBy
Raw list items usually need to be summed before you can chart them. My Customer Orders list has one row per order, with a Region choice column and an Amount currency column. I want one column per region.
I put the grouping in a named formula in App.Formulas, so several controls can reuse it. A choice column can’t be grouped directly, so the formula first adds a plain text RegionName. Learn more about Power Apps named formulas.
RegionTotals =
    DropColumns(
        AddColumns(
            GroupBy(
                AddColumns('Customer Orders', RegionName, Region.Value),
                RegionName,
                RegionOrders
            ),
            TotalAmount, Sum(RegionOrders, Amount)
        ),
        RegionOrders
    );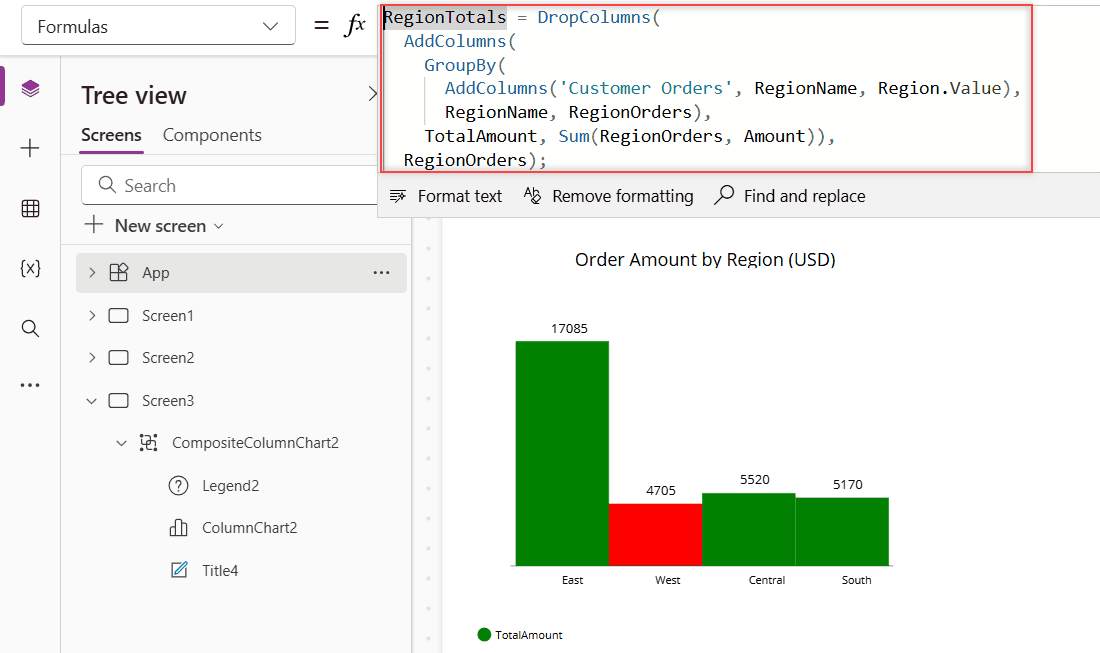
Set the chart’s Items to RegionTotals and NumberOfSeries to 1. Notice the column names have no quotes. That’s the current GroupBy and AddColumns syntax; older apps were converted automatically. There are more examples in this Power Apps GroupBy function guide.
GroupBy can’t be delegated to SharePoint. It only groups the first 500 rows by default, or up to 10,000 if you raise the data row limit in Settings. For bigger lists, filter first. Here’s how to fix Power Apps delegation warnings.
Color bars by a condition
In a chart with one series, ItemColorSet colors each column separately. So you can build the color table with ForAll over the same table the chart uses. Here, regions under $5,000 turn red:
ForAll(
    RegionTotals,
    If(TotalAmount >= 5000, Color.Green, Color.Red)
)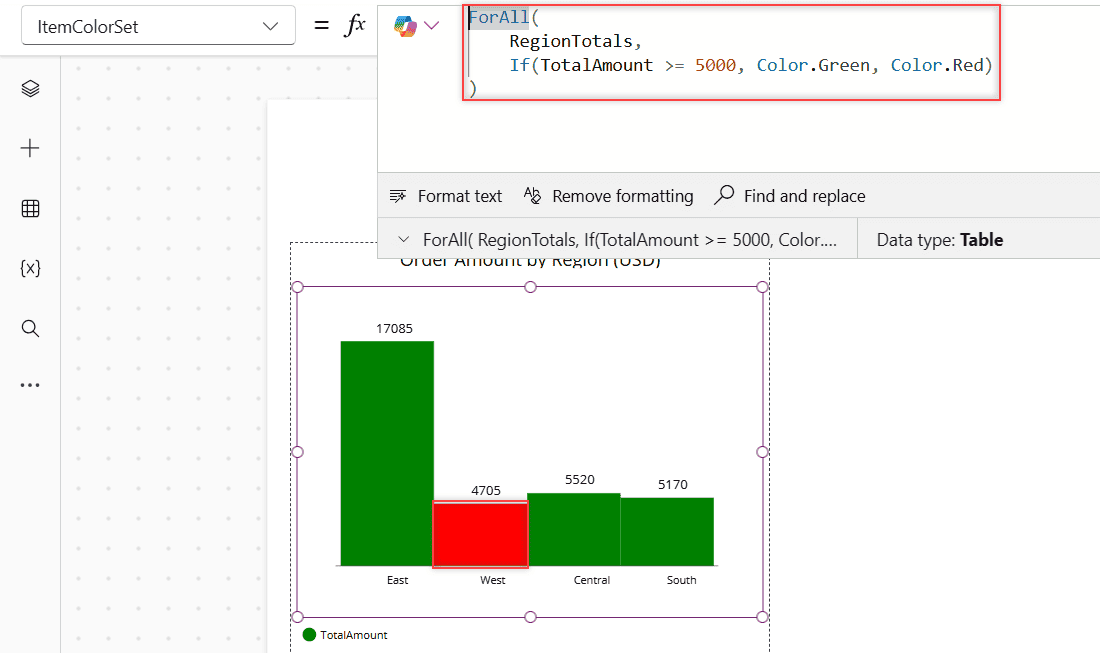
The colors are matched by position, so the ForAll has to loop over exactly the same table, in the same order, as Items. That’s why the named formula helps. I first tried Self.Items to avoid repeating the table, and Studio rejected it with a formula error.
Show percentages instead of totals
To show each region’s share of the total, calculate the percentage as a number and keep only the label and that column. Then set Markers to true and MarkerSuffix to "%":
DropColumns(
    AddColumns(
        RegionTotals,
        SharePct, Round(TotalAmount / Sum(RegionTotals, TotalAmount) * 100, 1)
    ),
    TotalAmount
)
Use Round, not Text, so the value stays a number the chart can draw. MarkerSuffix only adds text after each value label, it doesn’t change the numbers.
Formatting properties
| Property | What it does | Default I saw |
|---|---|---|
| GridStyle | Shows the x-axis, the y-axis, both or neither | X only |
| Markers | Shows the value above each column | On |
| MarkerSuffix | Text after each value, such as % (column chart only) | Blank |
| ItemsGap | Space between columns (column chart only) | 0 |
| MinimumBarWidth | Narrowest a column can get (column chart only) | – |
| SeriesAxisMin / SeriesAxisMax | Lowest and highest values on the value axis | Blank |
| XLabelAngle / YLabelAngle | Angle of the axis labels | 60 / 0 |
| Size | Font size of labels and values | – |
For accessibility, Microsoft recommends a title label right before the chart, a legend when there’s more than one series, and markers turned on. The Power Apps pie chart has its own settings, such as Explode and LabelPosition.
Limits of the built-in column chart
- No stacked or horizontal bars, and no tooltips or drill-down.
- Data labels are numbers only. You can’t format them as currency, apart from adding a suffix.
- Everything is calculated in the app, so large lists hit the delegation limit.
When you need more, add a Power BI tile from the same Charts group and show a tile pinned to a Power BI dashboard instead. Build the visual in Power BI first, for example a stacked column chart in Power BI, and pin it.
Troubleshooting
- The chart is blank: the value columns are text, or the collection is empty. Run App.OnStart in Studio, and make sure the values are numbers.
- Items is grayed out: you selected the group. Click the middle of the chart to select ColumnChart1.
- Only one series shows: NumberOfSeries is still 1.
- Colors land on the wrong series: check the legend order and list the colors in that order.
- The totals look too low: GroupBy only saw the first 500 rows. Raise the data row limit or filter first.
Keep building your Power Apps dashboard with these:
Frequently Asked Questions
How many series can a Power Apps column chart show?
Up to 9. Set NumberOfSeries to the number of value columns you want, as described in the column and line chart reference.
Why is my Power Apps column chart empty?
Usually the value columns hold text instead of numbers, or the data source is empty. Text such as “$120” or the output of Text() won’t draw columns.
How do I change the color of each bar?
With one series, give ItemColorSet one color per row, for example with ForAll over the chart’s data. With several series, ItemColorSet sets one color per series.
Where are the Labels and Series settings?
Current Studio doesn’t show them. The chart uses the text column for labels and the number columns for series, so shape the Items table instead.
Can a Power Apps column chart be stacked or horizontal?
No. The classic chart only draws vertical columns. Use a Power BI tile for stacked or horizontal bar charts.

I have worked with Microsoft technologies for more than 18 years, including SharePoint, Microsoft 365 and the Power Platform (Power Apps, Power Automate and Power BI), at companies like HP, TCS and KPIT. I started EnjoySharePoint in 2011 to share the solutions I build in real projects with readers in the United States, Canada, the United Kingdom, Australia, New Zealand and beyond. Microsoft has recognized this work with the Microsoft MVP award 13 times since 2014.