How to Sum and Group By Multiple Columns in Power BI (Complete Guide)

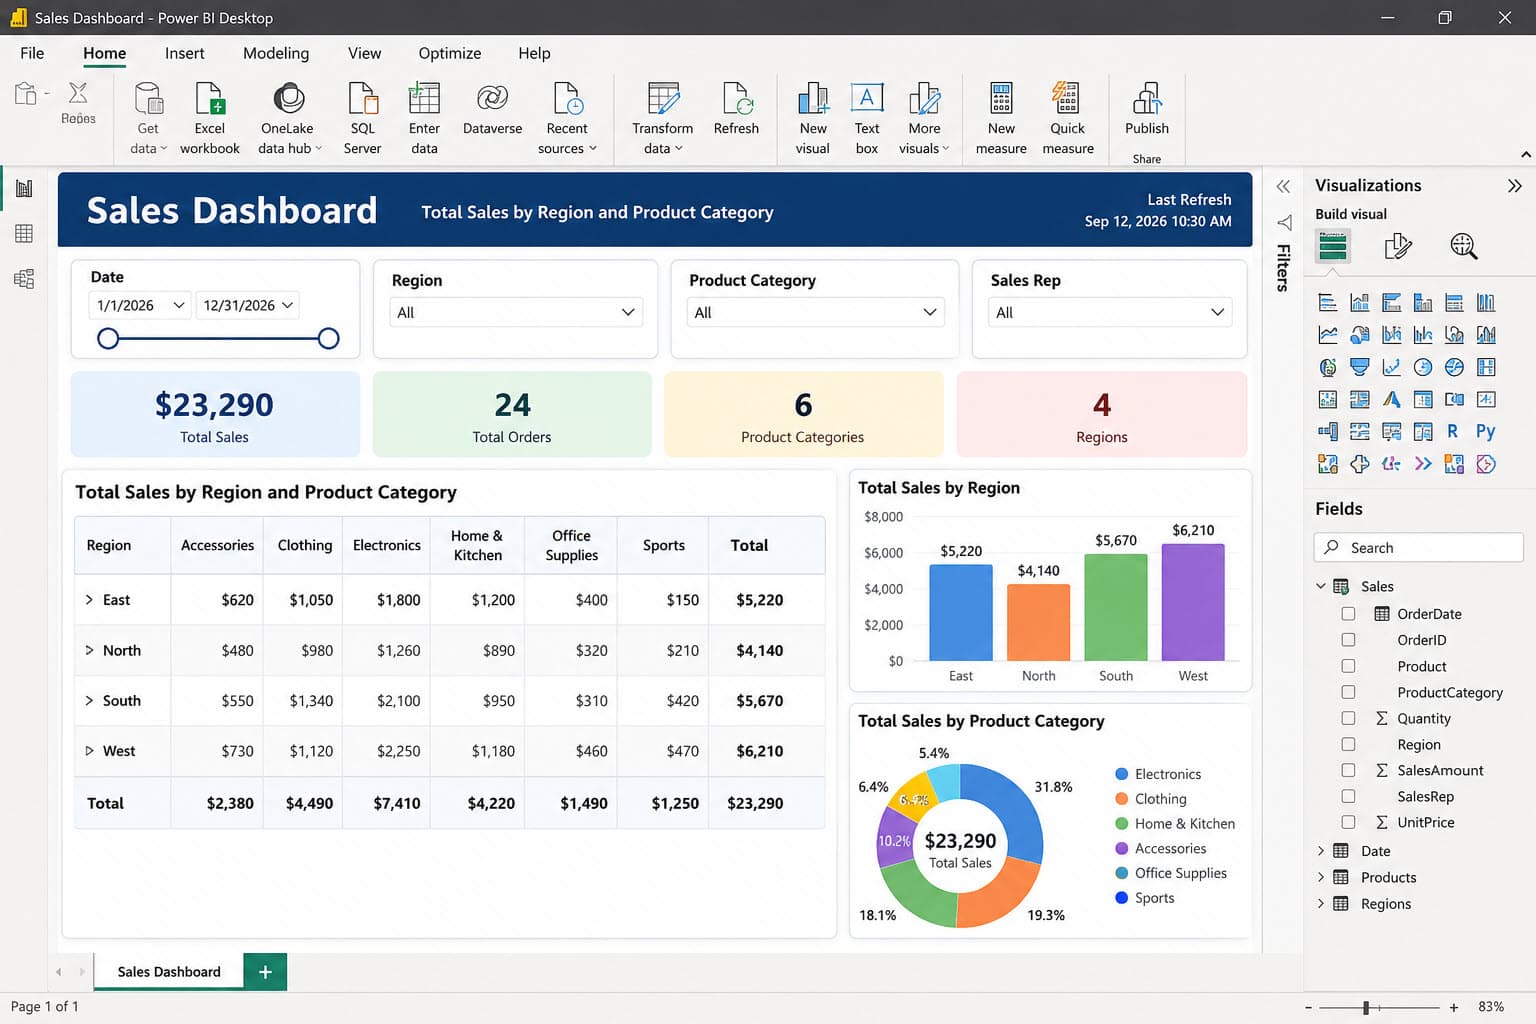
Sum and Group By Multiple Columns in Power BI

Every retail or finance report I’ve built eventually hits the same request: “Can you show me total sales by region and product category, together?” A sales manager doesn’t just want one total — they want the numbers broken down by two, sometimes three, columns at once. That’s exactly where grouping and summing by multiple columns … Read more >>>

10 Power BI Dashboard Examples You Can Use Right Now

best power bi dashboard examples

Most Power BI dashboards fail for a surprisingly simple reason — not because the data is wrong, but because they were built without a clear audience in mind. I’ve seen dashboards with 30 visuals on one page that told no story at all, and I’ve seen a single-page dashboard with 5 KPIs that helped a … Read more >>>

Power BI Card Visual: How to Use the New Card Visual

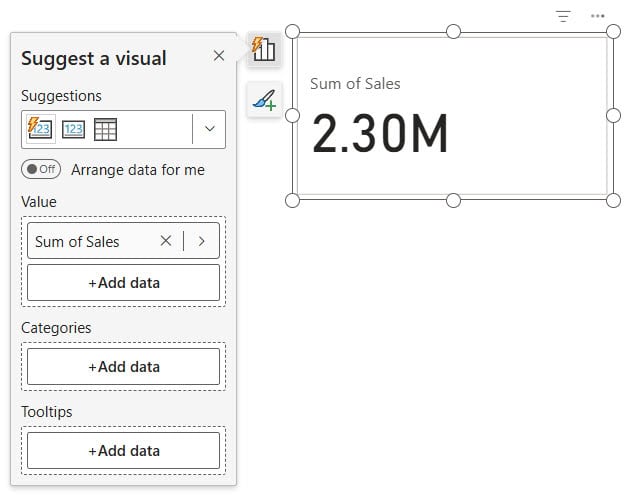
Power BI Card Visuals

You’re building a Power BI report, and all your stakeholders want to see is one number — Total Revenue, Units Sold, or Average Discount. No chart, no table, just the number front and center. That’s exactly what the Power BI Card visual is built for. But here’s what most tutorials won’t tell you: Microsoft completely redesigned the Card … Read more >>>