How to Add Filters in Power BI (Visual, Page and Report Level)
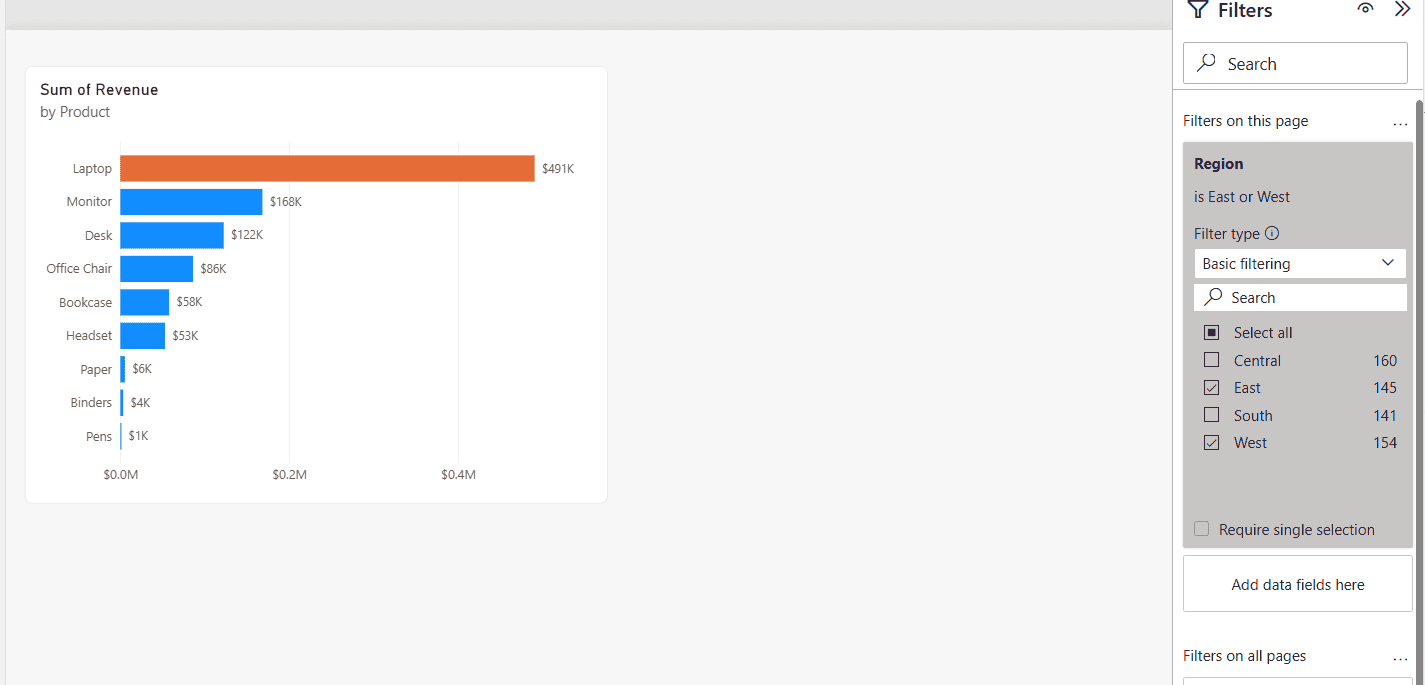
Power BI Filters pane with a page-level Region filter, Basic filtering with East and West selected, and the bar chart showing only East and West revenue

A regional sales report I built had four pages, and every page needed to show only the East and West regions, while one chart on the first page should only list products above $80,000. Both requests are filters, just at different levels, and choosing the right level saves you from repeating the same filter on … Read more >>>
Power BI Matrix Visual Conditional Formatting

Power BI Matrix Visual Conditional Formatting

Have you ever tried applying conditional formatting to your Power BI Matrix visual? That makes your data more engaging and easier to understand. You can add background colors, font colors, data bars, icons, or web links to your matrix visualization to highlight the data. In this tutorial, I will explain how to apply conditional formatting … Read more >>>

2 Various Ways to Change the Visual in Power BI

Change Visual with Bookmark Buttons in Power BI

I recently worked with a client who needed to customize the visuals in their Power BI reports to reflect their business data better. Changing visuals in Power BI is a powerful way to enhance data presentation and make your reports more insightful. In this tutorial, I will show you how to change the visual in … Read more >>>

How to Create a Clustered Bar Chart in Power BI?

Clustered bar chart power bi change order

Recently, while working on a report, I was required to show multiple values by grouping them together. I researched this and found that a Power BI clustered bar chart is the best option. Even while doing a little more research, I found out that we can also do a lot of formatting in it, like … Read more >>>

Power Bi Stacked Column Chart Multiple Legends

Power Bi Stacked Column Chart Multiple Legends

Do you want to display multiple legends in the Power BI stacked column chart? This Power BI tutorial will explore how to achieve this by implementing a dynamic legend. Unfortunately, the Power BI Stacked column chart does not support adding multiple legends. However, I got an idea; we will create a dynamic legend. Instead of … Read more >>>

How to Show Percentage in a Power BI Bar Chart Data Label?

Show Percentage in a Power BI Bar Chart Data Label

I recently worked for a client who asked me to create a bar chart showing sales based on segments with data labels. Yes, we can do it. Then, another requirement came to show the sales value in percentage value in the bar chart data labels. I researched this and found that we can show percentage … Read more >>>

Create Ribbon Chart in Power BI

Power bi ribbon chart

Recently, I was working on a Power BI report for a client. The report is based on the ‘Product Sales and Profits’. As one of their requirements was to view the profit of different product categories each year, which should show the category with the highest profits, and also the category with the lowest profits. … Read more >>>

Create a Matrix Visual in Power BI

Create a matrix visual using Power BI

Do you want to learn how to use a matrix visual in Power BI? I will help you with some Power BI matrix examples. In this Power BI tutorial, I will explain Power BI Matrix visualization. Along with this, I will also cover some more topics mentioned below: What is a Matrix Visual in Power … Read more >>>