
To sort a stacked bar chart in Power BI by value, select More options (…) on the visual, point to Sort by, choose the value field, such as Sum of Revenue, and then pick Sort descending or Sort ascending. The bars are then ordered by their total, which is the sum of all segments.
At Contoso, the sales manager wanted the regions in a revenue chart in two different ways: biggest first for the weekly review, and in a fixed West-to-East order for the board deck. In this tutorial, I’ll show both, plus how to sort by one segment and how to change the order of the segments inside each bar.
Quick answer: By total value: More options (…) > Sort by > your value field > Sort descending. By one segment: add a CALCULATE measure to Tooltips and sort by it. Segment order: More options > Sort legend. Custom bar order: add an order column in Power Query, then Column tools > Sort by column.
The sample chart
My report has a Sales table with 600 orders from 2025 and 2026. The stacked bar chart has Region in Y-axis, Revenue in X-axis and Category in Legend. If you still need to build the chart, see how to create a stacked bar chart in Power BI first.
Each bar shows a region’s total revenue, split into Furniture, Office Supplies and Technology. Central is the biggest region at $0.59M, and West is the smallest at $0.46M.
Sort a stacked bar chart by total value
When you build the chart, Power BI already sorts it by the value field, largest first. You only need the menu to switch the direction or to go back to it after sorting by name.
- Select the chart, then select More options (…) in its top-right corner.
- Point to Sort by. The submenu lists the fields in the chart: Region and Sum of Revenue.
- Select Sum of Revenue to sort by value, or Region to sort A to Z.
- Open the same submenu again and pick Sort descending (biggest at the top) or Sort ascending.
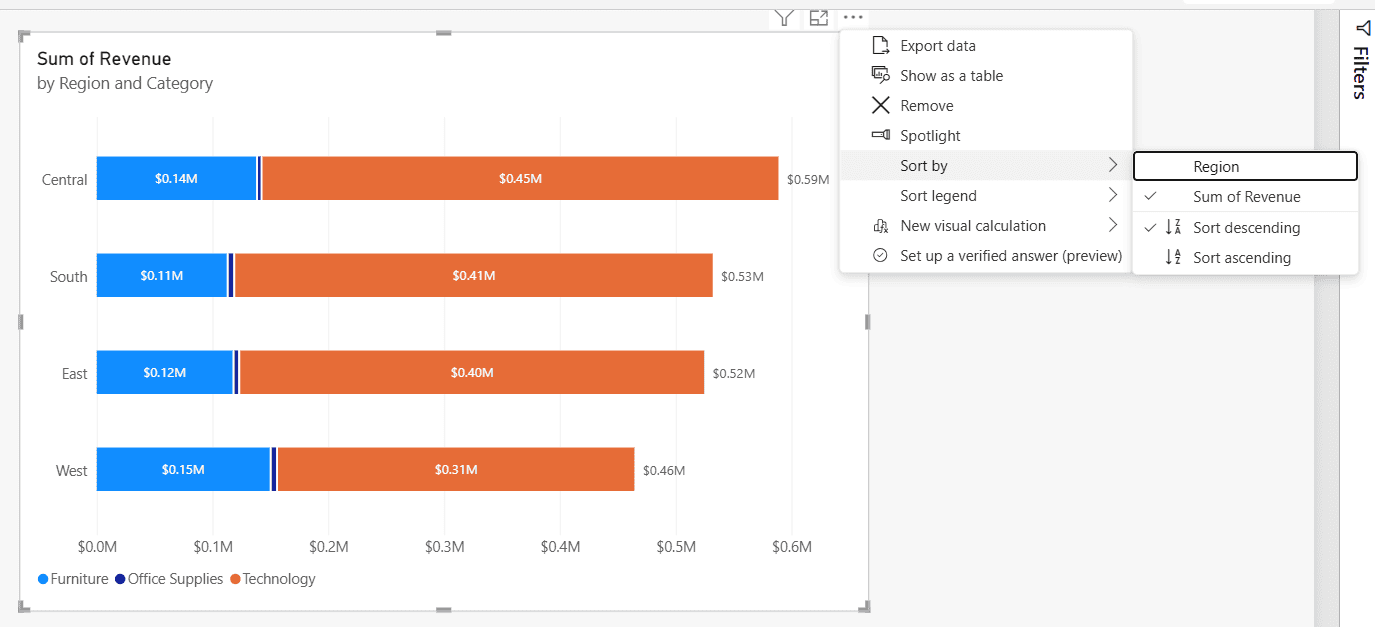
The check marks show the current sort: Sum of Revenue, descending. Sorting by value always uses the total of the bar, not one of its segments. Older versions of Power BI called this menu Sort axis, so you’ll still see that name in many articles.
For other visuals, the idea is the same. The steps for tables and matrices are in how to sort a Power BI matrix, and sorting by a measure that isn’t on the chart is covered in Power BI sort by measure.
Sort the bars by one segment
Sometimes the total isn’t what you care about. Say you want the region with the most Technology revenue at the top, even if its total is lower. Power BI can only sort by a field that’s in the visual, so you add a measure for that one segment and place it where it doesn’t change the bars.
- Create this measure with New measure on the Home tab.
- Drag it into the chart’s Tooltips well. The bars don’t change, but the measure now shows up in the sort list.
- Go to More options (…) > Sort by > Technology Revenue, then Sort descending.
Technology Revenue =
CALCULATE ( SUM ( Sales[Revenue] ), Sales[Category] = "Technology" )
If CALCULATE filters are new to you, see how to filter a measure in Power BI. The same trick works for sorting by any value that isn’t on the axes, such as profit or order count.
Sort by total when the stacks are separate measures
If you stack measures instead of using a legend, for example Total Cost and Total Profit in X-axis, the Sort by list shows each measure, but not their sum. Create a measure that adds them up, put it in Tooltips and sort by it:
Total Cost and Profit = [Total Cost] + [Total Profit]Now Sort by > Total Cost and Profit > Sort descending puts the longest bar at the top.
Change the order of the segments (Sort legend)
This answers the other common question: how do I change which color comes first inside each bar? By default, the segments follow the legend field in A to Z order, so Furniture comes first.
Select More options (…) > Sort legend > Category, and then Sort descending or Sort ascending.
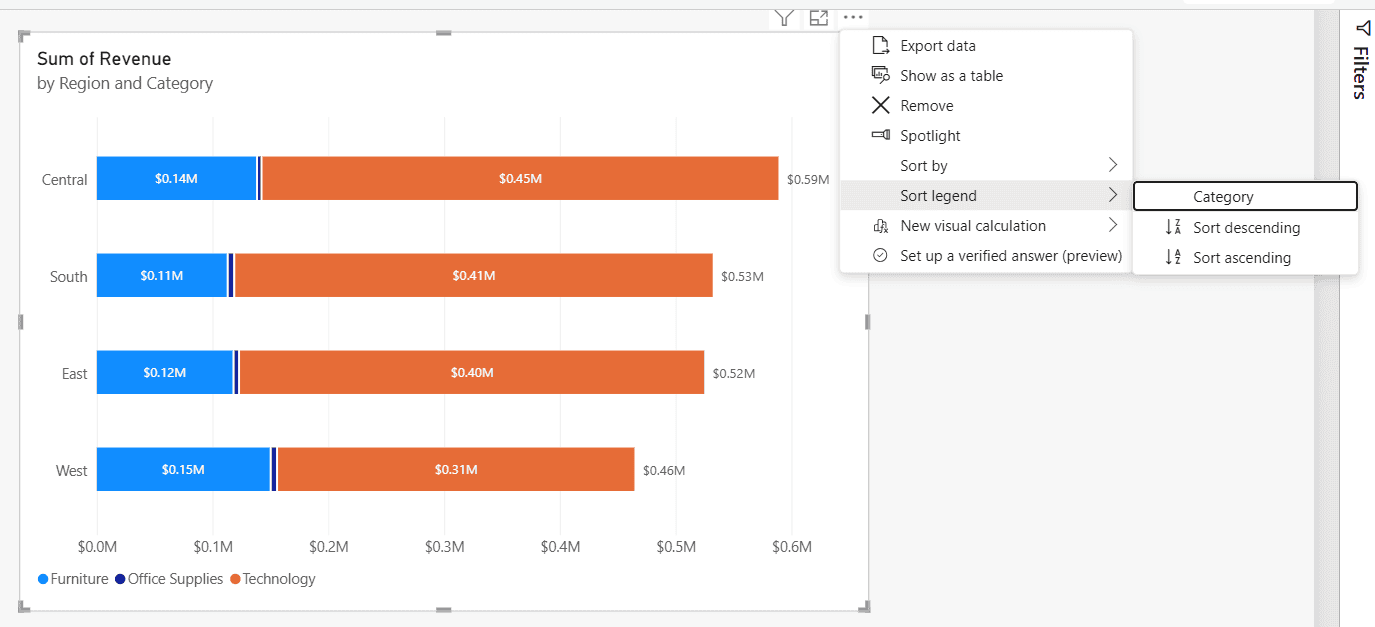
After Sort descending, Technology starts each bar and the legend reads Technology, Office Supplies, Furniture. The bar order doesn’t change, because Sort by and Sort legend are separate settings.
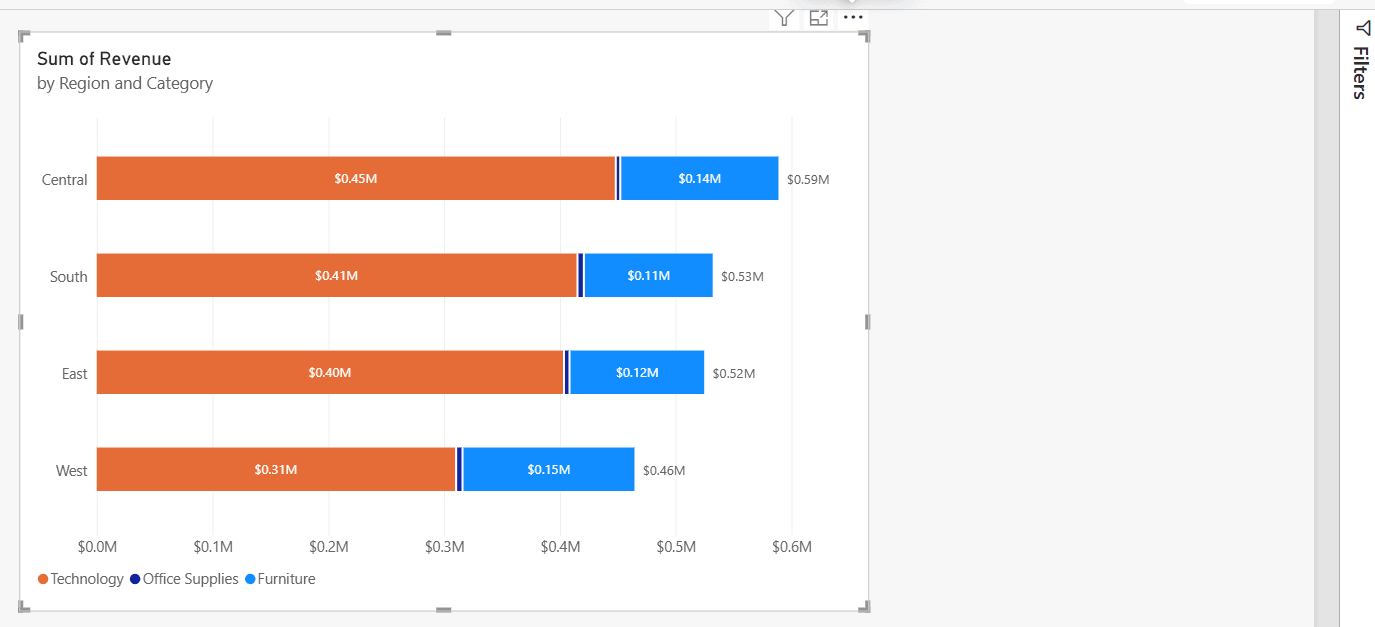
Putting the biggest segment first makes it easier to compare, because it always starts at zero. For any other segment order, use a sort column on the legend field, as in the next section.
Sort the bars in a custom order
For the board deck, the regions had to appear West, Central, South, East, no matter the revenue. Power BI does this with a sort column: a number for each region, and the Region column told to sort by it.
Step 1: Add the order column in Power Query
Select Home > Transform data. In Power Query, select Add Column > Custom Column, name it Region Order, and enter this formula. Then select OK and Close & Apply. If you’re not sure where Power Query ends and the report begins, see Power Query vs Power BI.
if [Region] = "West" then 1
else if [Region] = "Central" then 2
else if [Region] = "South" then 3
else 4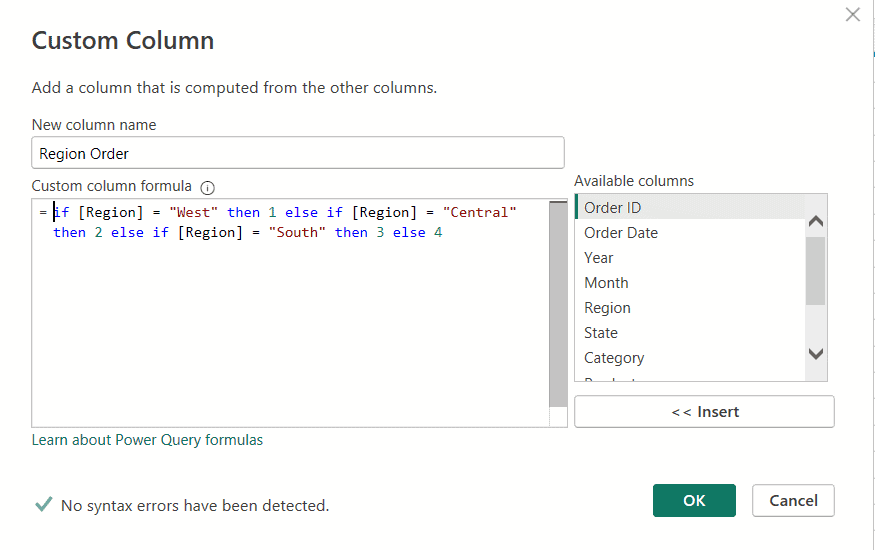
Why Power Query and not a DAX calculated column? I tried DAX first, and it fails, as explained in the troubleshooting section below. A small lookup table with Region and Region Order also works, and it’s easier to maintain when there are many values.
Step 2: Sort Region by Region Order
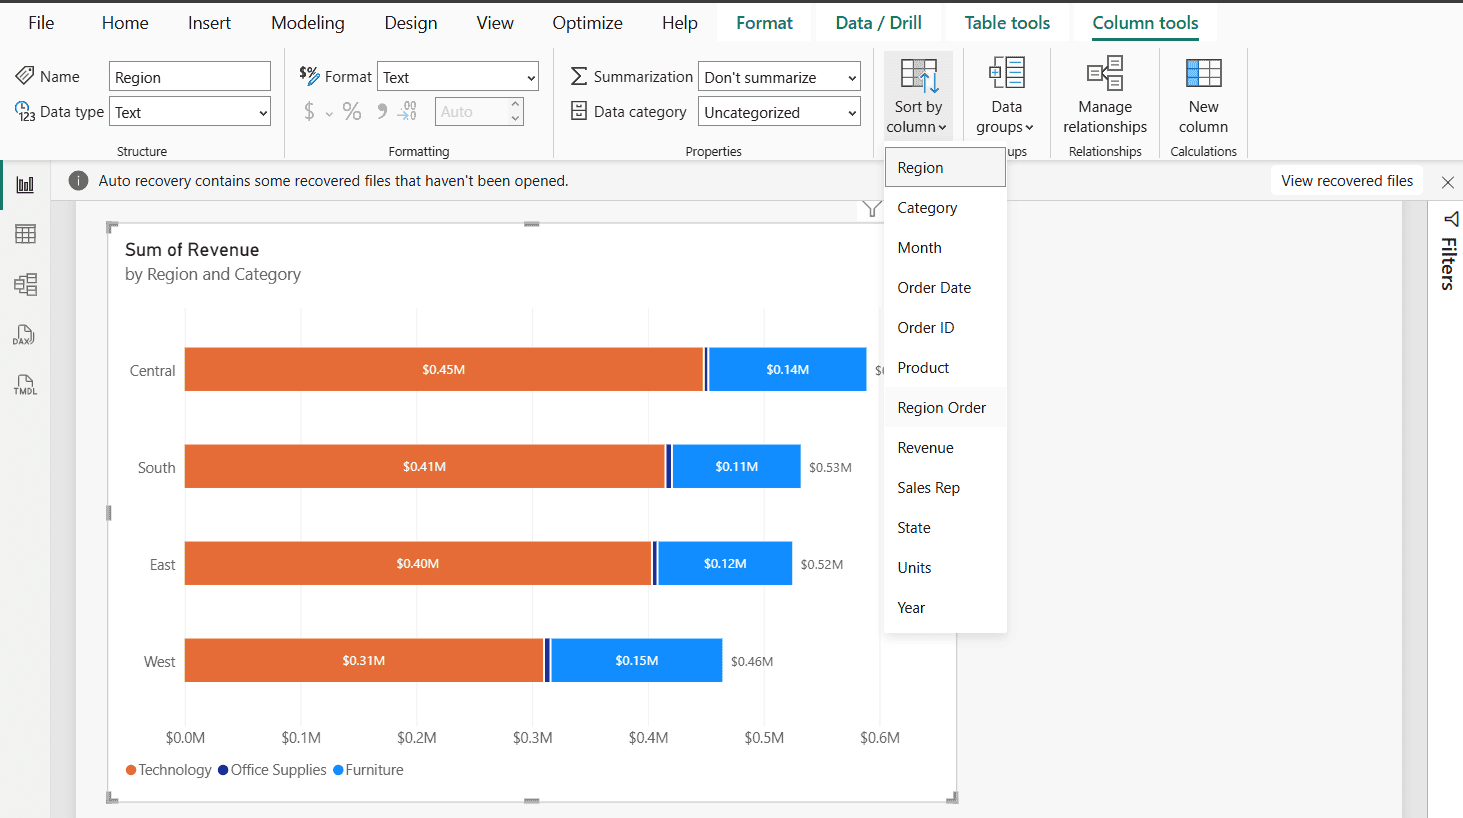
Back in the report, select the Region field in the Data pane. On the Column tools tab, select Sort by column > Region Order.
Step 3: Sort the chart by Region
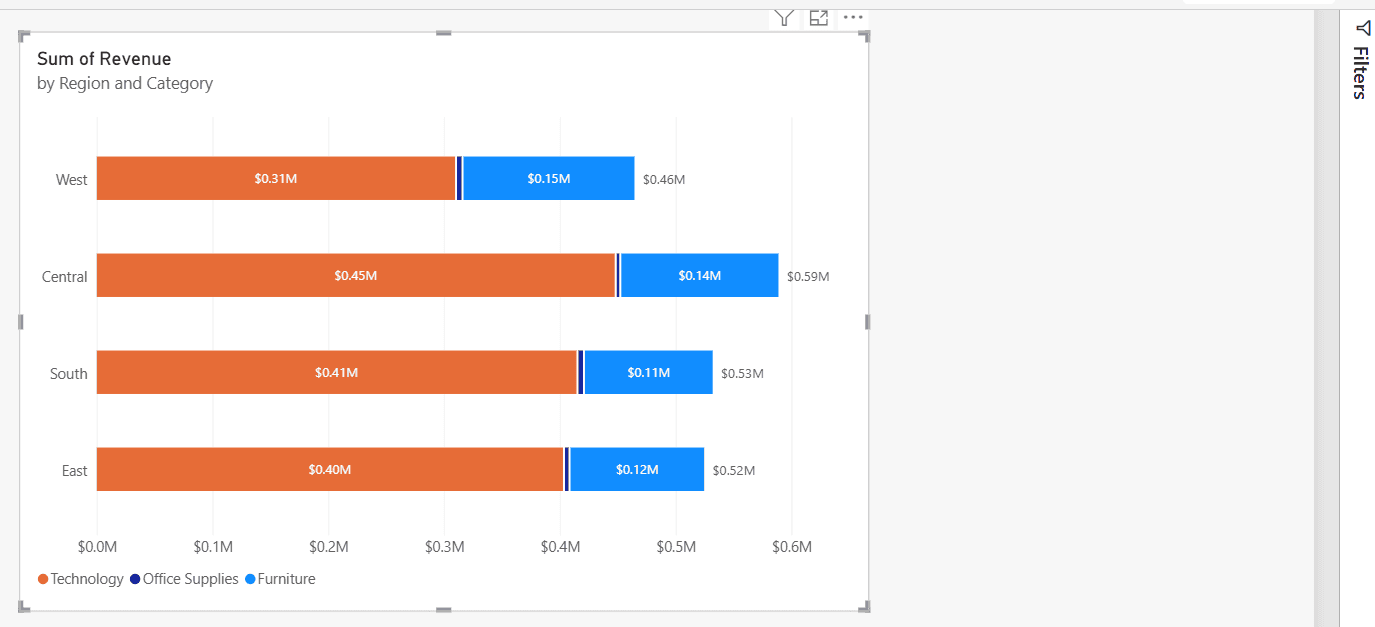
On the chart, select More options (…) > Sort by > Region, then Sort ascending. The bars now follow Region Order instead of the alphabet or the revenue.
The same method fixes month names that sort April, August, December. Sort the Month column by a month number column, then sort the chart by Month. For the legend, sort the legend field by its own order column. You’ll find more bar chart options in how to create a bar chart in Power BI.
Troubleshooting
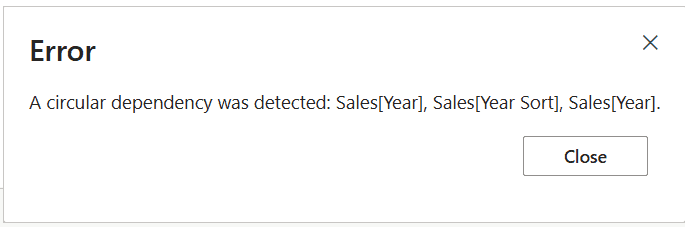
- “A circular dependency was detected”: the sort column is a DAX calculated column built from the column you’re sorting. Create it in Power Query or in a separate table instead.
- “Cannot use this column for sorting”: Microsoft explains that each value must map to one sort value. If West has 1 on some rows and 2 on others, fix the data first.
- The field I want isn’t in the Sort by list: only fields in the visual appear. Drag the field or measure into Tooltips.
- Sort by value doesn’t follow one color: that’s expected, because the bars sort by their total. Use the one-segment measure above.
If you’re polishing the same report, these chart tutorials are useful next:
Frequently Asked Questions
How do I sort a stacked bar chart by total in Power BI?
Select More options (…) on the chart, point to Sort by and choose the value field, then pick Sort descending. Power BI sorts the bars by the total of all segments.
How do I change the order of the colors in a stacked bar chart?
Use More options (…) > Sort legend and pick the legend field with Sort ascending or Sort descending. For any other order, sort the legend field by an order column with Column tools > Sort by column.
Can I sort a stacked bar chart by one segment?
Yes. Create a CALCULATE measure for that segment, add it to the Tooltips well, and choose it under Sort by.
Why do I get a circular dependency error with Sort by column?
Because the sort column is calculated from the column being sorted. Microsoft’s Sort by column guide covers the rules; create the order column in Power Query or a lookup table instead.
Where is Sort axis in Power BI?
Current versions of Power BI Desktop show it as Sort by in the visual’s More options (…) menu. It lists the fields in the visual plus Sort descending and Sort ascending.

Preeti Sahu is a Microsoft MVP for Power Apps with over six years of experience working with SharePoint Online and the Power Platform. She is the co-author of the book Microsoft Power Platform: A Deep Dive. As a Power Platform developer, she has built various tools with Power Apps and Power Automate, and she makes Microsoft 365 videos for YouTube.