
A sales manager I worked with wanted one screen in her Power Apps app that showed, at a glance, which product brought in the most revenue. A table of numbers didn’t do it, but a pie chart did: every slice showed a product’s share of total sales.
In this tutorial, I’ll show you how to build a pie chart in a Power Apps canvas app from a collection and from a SharePoint list, how to group repeating rows, show values and percentages on the slices, and pick colors that are easy to read.
Quick answer: Select Insert > Charts > Pie chart. Then set the chart’s Items to a table whose first column holds the labels and second column holds numbers, for example a collection with Source and Revenue. If the same label appears on several rows, group them first with GroupBy() and Sum().
What the pie chart control is
The pie chart is a grouped control with three parts: a title label, the chart itself and a legend. The chart reads the labels from the leftmost column of its Items table and the values from the second column, and the values must be numbers.
To add one, open your canvas app and select Insert > Charts > Pie chart. It appears with sample data:
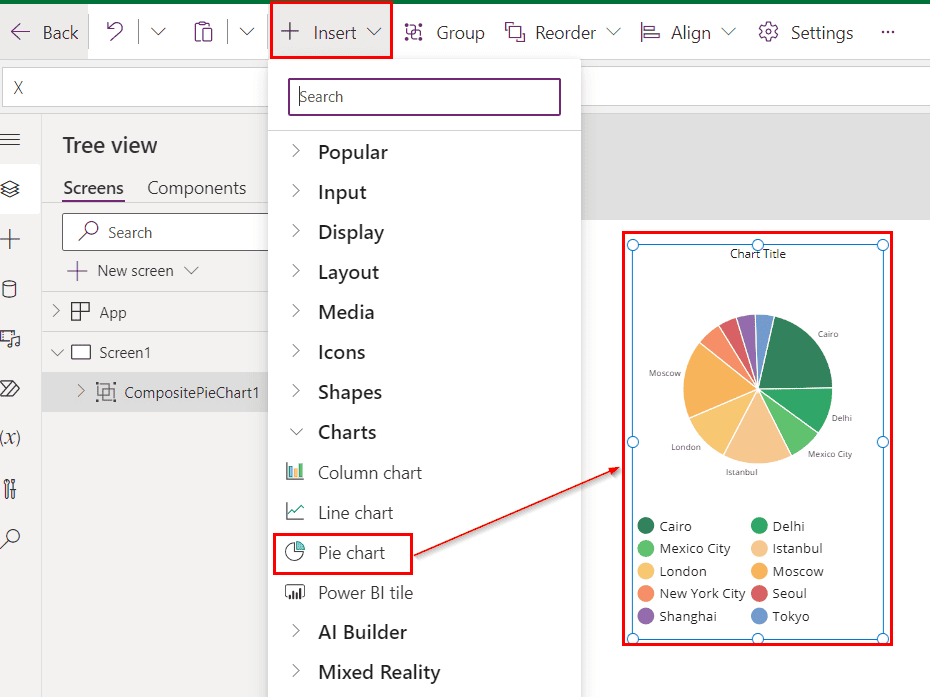
These are the properties you’ll use most:
| Property | What it does |
|---|---|
| Items | The data to chart: labels in the first column, numbers in the second |
| ShowLabels | Shows the value next to each slice |
| LabelPosition | Puts labels inside or outside the slices (Outside is easier to read) |
| ItemColorSet | The colors of the slices, in order |
| Explode | The gap between slices |
| ItemBorderColor, ItemBorderThickness | The border around each slice |
The same rules apply to the other chart types. See the Power Apps chart control guide for an overview, or the Power Apps column chart if you need to compare values side by side.
Example 1: A pie chart from a collection
Let’s start with a collection, so you can try it without any data source. Set the screen’s OnVisible property to:
ClearCollect(
    colRevenue,
    {Source: "Amazon", Revenue: 450},
    {Source: "Google", Revenue: 359},
    {Source: "Microsoft", Revenue: 380},
    {Source: "Instagram", Revenue: 256},
    {Source: "Facebook", Revenue: 230},
    {Source: "X", Revenue: 186},
    {Source: "Snapchat", Revenue: 103}
)
Notice that Revenue holds numbers, like 450, not text like “$450”. If you store the values as text, the chart can’t size the slices, which is the most common reason a Power Apps pie chart looks wrong.
Select the chart part of the control (PieChart1 in the Tree view) and set its Items to colRevenue. Each source now gets a slice sized by its revenue.
For more ways to build collections, see the Power Apps collection guide.
Example 2: A pie chart from a SharePoint list
Next, I used a SharePoint list named Products Revenue with a product name in the Title column and number columns for Total Sales, Gross Profit, Operating Expenses and Net business result:
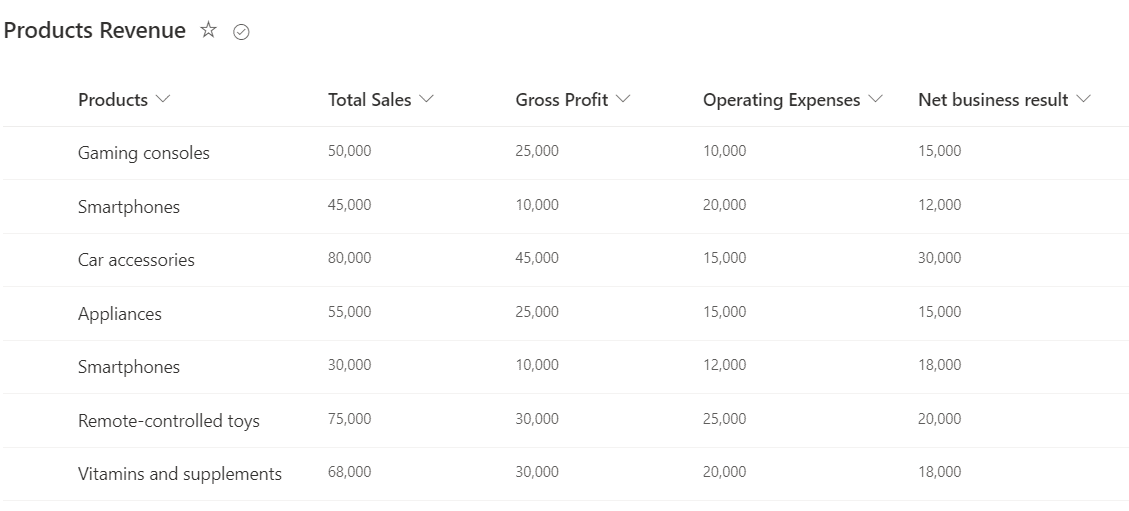
Add the list as a data source, set the chart’s Items to 'Products Revenue', and in the Properties pane set Labels to Title and Series to TotalSales:

Look closely and you’ll see the same product more than once, because the list has several rows for it. Grouping fixes that. If you’re new to lists as a data source, see how to create a collection from a SharePoint list.
Example 3: Group the data by product
To get one slice per product, group the rows and add up their sales in the chart’s Items:
AddColumns(
    GroupBy('Products Revenue', Title, ProductRows),
    TotalSales, Sum(ProductRows, 'Total Sales')
)GroupByputs all rows with the same Title together in a table column I named ProductRows.AddColumnsadds a TotalSales column with the sum of each group.- Then set Labels to Title and Series to TotalSales in the Properties pane.
Column names are written without quotes. Older posts, including an earlier version of this one, used "Title" in quotes, which is the syntax Power Apps used before 2024.
GroupBy can’t be delegated, so it only reads the first 500 rows of a list (up to 2,000 if you raise the data row limit). For bigger lists, see how to fix Power Apps delegation warnings. There’s more on grouping in how to group by and calculate a sum in Power Apps.
Example 4: Show values and percentages
To show the numbers on the chart, set ShowLabels to true and LabelPosition to LabelPosition.Outside, which keeps small slices readable.
For percentages, build a label column that holds text such as “Smartphones 21.4%”, and keep the numeric column for the slice sizes:
With(
    {Grand: Sum('Products Revenue', 'Total Sales')},
    AddColumns(
        GroupBy('Products Revenue', Title, ProductRows),
        TotalSales, Sum(ProductRows, 'Total Sales'),
        SliceLabel, Title & " " & Text(Sum(ProductRows, 'Total Sales') / Grand * 100, "0.0") & "%"
    )
)
Set Labels to SliceLabel and Series to TotalSales. The legend then shows each product with its share, and the slices are still sized by the sales numbers.
Don’t set Series to the text column. It has to stay a number column, or every slice disappears. And I add the % sign as text after Text(..., "0.0"), rather than using a % format code, so the result is always what you expect.
Example 5: Set the slice colors
Set the chart’s ItemColorSet to a list of colors, one per slice, in the same order as the rows. Pick colors that contrast with each other and with the background:
[Color.SteelBlue, Color.DarkOrange, Color.SeaGreen, Color.Crimson, Color.MediumPurple, Color.Goldenrod, Color.Teal, Color.SlateGray]
If there are more slices than colors, Power Apps repeats them. Very light colors, like AliceBlue, are hard to see on a white screen, so I avoid them. To color a chart based on a value instead, the same idea as gallery conditional formatting applies.
Charts in Power Apps in 2026
There’s still no modern chart control for canvas apps, so the classic pie, column and line chart controls are the built-in options. The Copilot control can’t be added to new canvas apps since February 2, 2026, and the AI chart feature in Power Apps works only in model-driven app views.
For richer visuals, such as drill-down or many series, add a Power BI tile from Insert > Charts > Power BI tile and build the chart in Power BI.
Troubleshooting
- All slices are the same size, or the chart is empty: the values are text. Store them as numbers, or wrap them in
Value(). - The same label appears several times: group the rows with GroupBy and Sum, as in Example 3.
- Some items are missing: GroupBy reads only the first 500 to 2,000 rows. Filter the list first.
- The legend is missing: keep the legend part of the control. Microsoft recommends it for accessibility, together with ShowLabels.
These Power Apps tutorials go well with charts:
Frequently Asked Questions
How do I create a pie chart in Power Apps?
Select Insert > Charts > Pie chart and set Items to a table with labels in the first column and numbers in the second. Microsoft lists every property in its pie chart control reference.
Why does my Power Apps pie chart show wrong or equal slices?
The values are probably text, such as “$450”. The chart needs numbers, so store them as numbers or convert them with Value().
How do I show percentages on a Power Apps pie chart?
Add a text column with the percentage, for example with Text(part / total * 100, “0.0”) & “%”, use it for Labels and keep a number column for Series.
Is there a modern chart control in Power Apps?
Not for canvas apps as of 2026. Use the classic chart controls or a Power BI tile.

I have worked with Microsoft technologies for more than 18 years, including SharePoint, Microsoft 365 and the Power Platform (Power Apps, Power Automate and Power BI), at companies like HP, TCS and KPIT. I started EnjoySharePoint in 2011 to share the solutions I build in real projects with readers in the United States, Canada, the United Kingdom, Australia, New Zealand and beyond. Microsoft has recognized this work with the Microsoft MVP award 13 times since 2014.